Shu Wang, Yuxuan Liu, Yujia Du, Yan Li, Guo Li, Huafeng Shan, Chun Wang, Haining Wang (2026). Construction and Validation of a Multi-Level Evaluation System for Mattress Comfort. In: Human Factors and Ergonomics In Design. AHFE Open Access, vol. 210, pp. 247–259. https://doi.org/10.54941/ahfe1007446
Robust mattress comfort evaluation is essential for translating human-mattress interaction evidence into actionable product design requirements; however, current studies and standards often use non-aligned indicator sets and frequently treat comfort as a static, single-time-point construct. This study developed and validated a hierarchical, human-centered evaluation system that integrates subjective perceptions with objective interface pressure metrics and explicitly differentiates early- and later-phase comfort perceptions. Based on a systematic literature review and relevant standards (e.g., GB/T 43007-2023; EN 1957), candidate indicators were refined through expert ratings (n = 5) and redundancy screening, yielding a four-level framework (goal–dimension–primary–secondary) comprising three dimensions, six primary indicators, and ten secondary indicators. A controlled within-subject experiment was then conducted with 28 adults (19 normal-weight; 9 overweight/obese; 14 males and 14 females; 21–36 years) who evaluated soft, medium, and firm mattresses using a 5-point Likert scale (−2 to +2) while supine interface pressure was recorded at 5 min (early phase) and 30 min (later phase). The questionnaire showed good internal consistency (Cronbach’s α = 0.82) and content validity (CVI = 0.86). Across both body types, medium firmness yielded the highest mean ratings for later-phase overall comfort and fatigue relief. Whole-body pressure metrics showed limited associations with overall comfort, whereas regional pressure parameters, particularly in the shoulder and waist, exhibited clearer and body-type-dependent relationships with comfort-related ratings. The proposed system provides a structured basis for standardized comfort assessment and supports region-specific (zonal) mattress optimization.
Mattress comfort is a key determinant of perceived sleep environment quality and musculoskeletal loading during prolonged rest. As comfort perception emerges from interactions among support, pressure redistribution, and thermal-tactile sensations, the evaluation methodology must be both
human-centered and operationalizable to guide product development and standardization.
Existing research typically applies objective measures such as interface pressure distribution (Park et al., 2001; Zhu et al., 2015), spinal alignment (Lahm and Iaizzo, 2002), and electromyographic activity (Hu et al., 2025; Min et al., 2015), alongside subjective ratings of comfort and preference (Mobeen et al., 2023; Ren et al., 2023). Several studies have begun to integrate subjective comfort ratings with pressure mapping for specific postures or populations (Hou and Zhang, 2020; Ren et al., 2023). Despite these advances, two methodological limitations persist. First, comfort is often treated as a single construct evaluated at a single time point, although perception can evolve as tissues adapt and localized discomfort accumulates during sustained lying. Second, indicators used in academic studies, standards, and commercial testing are frequently inconsistent, reducing comparability across studies and weakening translation into design requirements.
This work addresses these gaps by developing a multi-level evaluation system that links user-centered comfort constructs to measurable indicators and embeds a temporal structure for standardized assessment. Specifically, we aimed to: (1) construct a hierarchical indicator system for mattress comfort grounded in evidence and standards; (2) operationalize comfort as a two- phase experience (early vs. later perception); and (3) validate the system in a controlled experiment and examine how whole-body and regional pressure parameters relate to subjective comfort across body types. By identifying which objective metrics are most informative at the regional level, the study also provides design-relevant evidence for zonal mattress optimization.
METHODS
Evaluation System Development The hierarchical evaluation system was developed in three stages: (1) indicator pool establishment, (2) indicator screening, and (3) hierarchical organization with a temporal structure.
Stage 1: Indicator pool establishment. Candidate indicators were compiled from a systematic literature review (Web of Science, Scopus, and CNKI; keywords included “mattress comfort” and “sleep comfort evaluation”) and an analysis of relevant standards (e.g., GB/T 43007-2023 and EN 1957). Selected studies were peer-reviewed, focused on mattress comfort evaluation, and reported explicit, operationalizable indicators.
Stage 2: Indicator screening and redundancy removal. Five experts (two human factors/ergonomics professors and three senior mattress product developers) rated each candidate indicator on importance and feasibility using 5-point Likert scales (1 = extremely low; 5 = extremely high). Indicators with a mean score < 3.5 were removed. To improve parsimony, redundancy among retained indicators was assessed using correlations of expert scoring profiles; items showing high inter-item correlation (r > 0.8) were clustered and merged.
Stage 3: Hierarchical organization and temporal structure. The final system was organized into four levels: goal level (mattress comfort), three
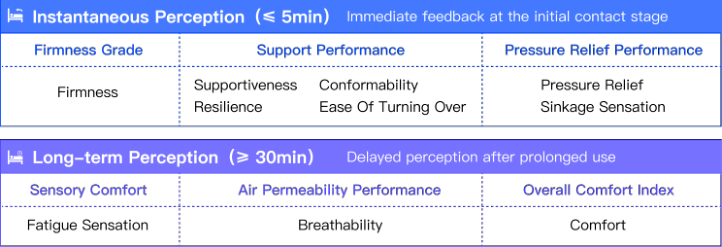
Construction and Validation of a Multi-Level Evaluation System for Mattress Comfort 249 dimensions, six primary indicators, and ten secondary indicators (Table 1). To capture the dynamic nature of comfort perception, indicators were assigned to two standardized time points: early perception assessed after 5 min of lying and later perception assessed after 30 min of lying (Figure 1). In this validation study, early-phase indicators focused on immediate support and pressure-related sensations, whereas later-phase indicators captured thermal sensation, fatigue relief, and overall comfort integration.
Table 1: Multi-level evaluation system for mattress comfort.
Table available in the original PDF paper.
Dimension Primary Indicator
Secondary Indicator Operational Definition
Mattress Performance Firmness Level Firmness
Perceived appropriateness of mattress firmness (neither too soft nor too hard) while lying.
Supportiveness
Perceived adequacy of support provided to body regions by the mattress.
Conformability
Perceived extent to which the mattress conforms to body contours and maintains continuous contact.
Support Performance Resilience Perceived ability of the mattress to recover its shape after unloading.
Ease of Turning Over
Perceived ease of posture adjustment or turning while lying.
Sinkage Sensation
Perceived appropriateness of sinkage/immersion (supportive cradling without excessive sinking) over time.
Pressure Relief Performance Pressure Relief
Perceived reduction of local pressure points (e.g., shoulders/ hips).
Air Permeability Performance Breathability Perceived heat dissipation and ventilation during lying.
Sensory Perception
Sensory Comfort Fatigue Relief
Perceived reduction in localized fatigue or discomfort during prolonged lying.
Comprehensive Comfort
Overall Comfort Index Overall Comfort
Overall satisfaction integrating support, pressure, and thermal– tactile sensations.
Figure 1: Two-phase mattress comfort evaluation framework: early perception (5 min) and later perception (30 min).
Participants Twenty-eight healthy adults (21–36 years; 14 males and 14 females) participated. Individuals reporting sleep disorders, lumbar/back disease, or reduced sensitivity to firmness variations were excluded. Participants were stratified by BMI into a normal-weight group (n = 19; 7 males and 12 females; BMI 18.5–23.9 kg/m²) and an overweight/obese group (n = 9; 7 males and 2 females; BMI ≥ 24.0 kg/m²). All participants provided informed consent before participation.
Table 2: Participant characteristics by body type.
Table available in the original PDF paper.
Height (cm) Weight (kg)
Group n (male/female) BMI range (kg/m²)
Average SD Average SD Normal-weight 19 (7/12) 18.5−23.9 165.26 9.00 57.43 8.85
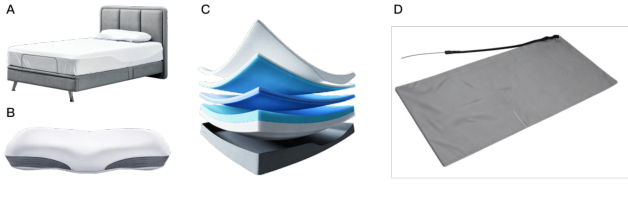
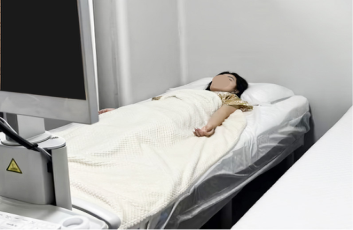
Experimental Equipment and Materials Three mattresses with identical dimensions (90 × 200 cm), appearance, and three-layer construction (comfort, buffer, and support layers) were tested. The mattresses differed only in firmness (soft, medium, and firm) (see Figure 2A, 2C). A standardized medium-firm pillow was used across conditions (Keeson Technology Co., Ltd., China) (see Figure 2B).
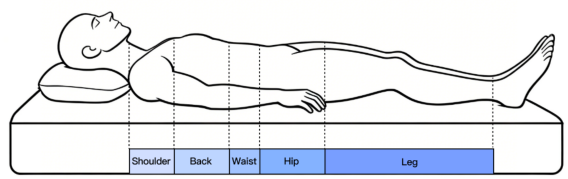
Interface pressure was measured using a body pressure measurement system (MATXL2842N, Yotlive, China) with a measurement range of 5–100 mmHg and a sampling frequency of 5 Hz. The body-mattress interface was segmented into zones (shoulder, back, waist, hip, and leg) for regional analysis (see Figure 3). Subjective comfort was assessed using a self- developed questionnaire derived from the evaluation system. Each indicator was rated on a 5-point Likert scale from −2 (Very uncomfortable) to +2 (Very comfortable) (see Figure 4 and Table 3). A stopwatch and camera were used to record trial timing and verify posture.
Figure 2: Experimental mattress (A), standardized pillow (B), mattress internal structure (C), and pressure mat (D).Figure 3: Body region segmentation for pressure analysis.Figure 4: Comfort rating scale (5-point Likert scale; −2 = Very uncomfortable, +2 = Very comfortable).Table 3: Comfort questionnaire.
Table available in the original PDF paper.
Dimension Evaluation
Rating Score Very UncomfortableUncomfortable Neutral Comfortable Very
Comfortable
Index −2 −1 0 1 2
Firmness Supportiveness
Early-phase Perception (5 min) Conformability Resilience Ease of Turning Over Sinkage Sensation Pressure Relief Later-phase Perception (30 min)
Breathability Fatigue Relief Overall Comfort
Experimental Procedure The experiment was conducted in a climate-controlled laboratory (26 ± 2 °C; 50% ± 5% RH) to minimize environmental influences. Each participant completed tests on all three mattresses in a randomized order to counterbalance sequence effects. The procedure included:
1. Pre-experiment: Demographic and anthropometric data (age, sex, height, weight, BMI) were collected after participants received standardized instructions. 2. Adaptation phase: Participants sat for 5 min to acclimate. 3. Early-phase evaluation (5 min): Participants lay supine in a standardized posture, with arms alongside the body and legs extended with slight abduction (Wu et al., 2018). After 5 min, interface pressure was recorded, and participants rated the instantaneous-perception indicators (firmness, supportiveness, conformability, resilience, ease of turning over, sinkage sensation, and pressure relief). 4. Later-phase evaluation (30 min): Participants remained supine and were instructed to minimize intentional movement. After 30 min, pressure recording and ratings of the longer-term indicators (breathability, fatigue relief, and overall comfort) were repeated. 5. Rest phase: Participants rested for 10 min between mattress conditions to reduce carryover effects.
Data Processing and Statistical Analysis Subjective ratings were summarized as mean ± standard deviation (SD). Internal consistency of the subjective questionnaire was assessed using Cronbach’s α. Content validity was evaluated using the content validity index (CVI) derived from expert ratings.
Pressure values recorded in mmHg were converted to kPa for analysis and reporting (1 mmHg = 0.133 kPa). In addition to total contact area (area
Construction and Validation of a Multi-Level Evaluation System for Mattress Comfort 253 of activated sensors), effective contact area was computed as the area of sensors with pressure ≥ 1.33 kPa and was used in the whole-body correlation analysis.
Objective pressure parameters included peak pressure (maximum interface pressure), mean pressure (average interface pressure), contact area (area of activated sensors), and a software-derived pressure index reflecting pressure concentration. Regional parameters were computed within body zones; pressure SD denotes the standard deviation of zone pressure values. Spearman correlation analyses were performed separately for normal-weight and overweight/obese groups to examine associations between subjective indicators and both whole-body and regional pressure parameters. Statistical significance was set at p < 0.05.
RESULTS
Reliability and Content Validity The questionnaire showed good internal consistency (Cronbach’s α = 0.82). The evaluation system also showed good content validity, with an overall CVI of 0.86.
Subjective Ratings Across Mattress Firmness Levels Tables 4 and 5 present early- and later-phase subjective ratings and objective pressure parameters for both body types. Statistical comparisons were performed using repeated-measures ANOVA (p < 0.05).
For the normal-weight group, the soft mattress received the highest early-phase mean ratings for conformability (1.53 ± 0.51, p = 0.002) and pressure relief (1.16 ± 0.60, no significant firmness effect). In contrast, the medium mattress received the highest later-phase mean ratings for overall comfort (0.74 ± 0.73, p = 0.030) and fatigue relief (0.79 ± 0.54, p = 0.014). Ease of turning over increased with firmness and was highest on the firm mattress (1.37 ± 0.68, p < 0.001).
For the overweight/obese group, the medium mattress showed the highest mean ratings for several key indicators, including early-phase conformability (1.22 ± 0.83, p < 0.001) and pressure relief (1.00 ± 0.87, no significant firmness effect), as well as later-phase fatigue relief (1.00 ± 0.71, p = 0.003) and overall comfort (1.11 ± 0.78, p = 0.004). Similar to the normal-weight group, ease of turning over was highest on the firm mattress (1.67 ± 0.50, p < 0.001).
Table 4: Normal-weight group: subjective ratings and pressure parameters across firmness levels (mean ± SD).
Construction and Validation of a Multi-Level Evaluation System for Mattress Comfort 255 Correlation Between Whole-Body Pressure Parameters and Subjective Scores
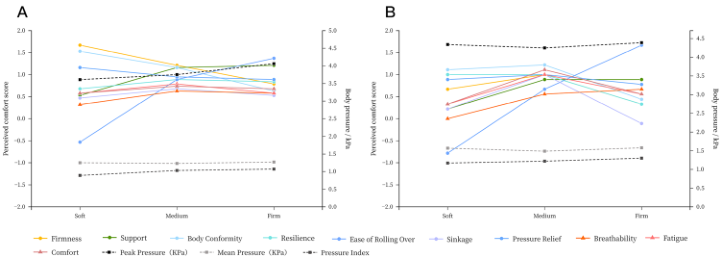
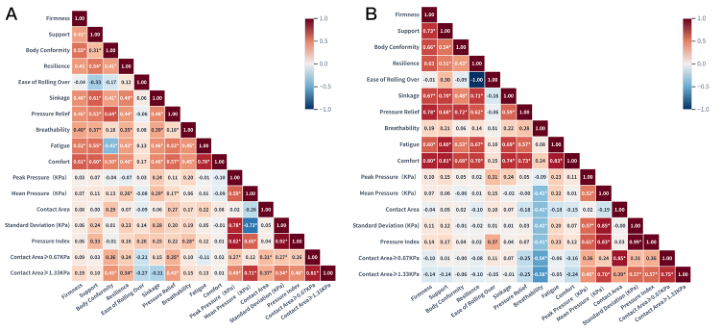
Across firmness levels, whole-body contact area and several comfort- related ratings tended to peak at medium firmness for both body types, whereas peak pressure and pressure index tended to increase with firmness (Figures 6 and 7).
In the normal-weight group, conformability was positively correlated with effective contact area (r = 0.453, p < 0.05), and resilience was positively correlated with mean pressure (r = 0.261, p < 0.05). No significant correlations were observed between overall comfort and whole-body pressure parameters.
In the overweight/obese group, breathability was negatively correlated with peak pressure (r = −0.425, p < 0.05) and mean pressure (r = −0.421, p < 0.05). Other subjective indicators showed no significant associations with whole-body metrics.
Figure 6: Changes in body pressure and perceived comfort across firmness levels for normal-weight (A) and overweight/obese (B) participants.Figure 7: Correlations between whole-body pressure indicators and perceived comfort for normal-weight (A) and overweight/obese (B) participants.
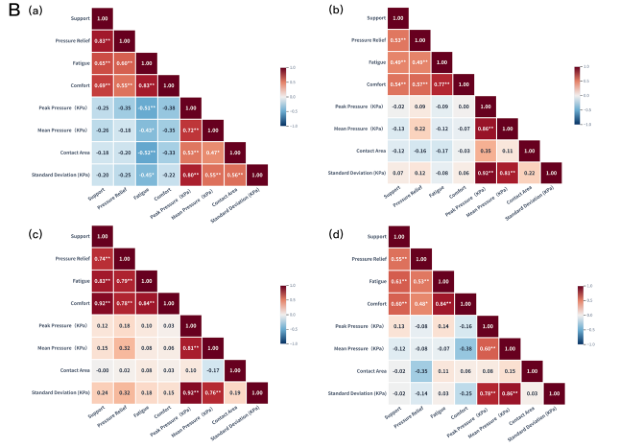
Correlation Between Regional Pressure Parameters and Subjective Scores Regional pressure parameters showed stronger and more interpretable relationships with subjective comfort than whole-body metrics, and the pattern differed by body type (Figure 8).
Figure 8: Correlations between regional pressure parameters and subjective comfort ratings for normal-weight (A: shoulder, back, waist, leg) and overweight/obese (B: shoulder, back, waist, leg) participants.
Construction and Validation of a Multi-Level Evaluation System for Mattress Comfort 257 For the normal-weight group, shoulder contact area was positively correlated with fatigue relief (r = 0.382, p < 0.01) and overall comfort (r = 0.452, p < 0.01). In the back region, overall comfort was positively correlated with pressure SD (r = 0.303, p < 0.05), and perceived pressure relief was positively correlated with contact area (r = 0.417, p < 0.01). In the waist region, perceived pressure relief showed weak positive correlations with mean pressure (r = 0.263, p < 0.05) and pressure SD (r = 0.269, p < 0.05).
For the overweight/obese group, fatigue relief ratings were negatively correlated with shoulder-region peak pressure (r = −0.505, p < 0.01), mean pressure (r = −0.429, p < 0.01), and contact area (r = −0.520, p < 0.01), indicating that shoulder-region load distribution was particularly salient for later-phase comfort. In the waist region, perceived pressure relief was weakly correlated with mean pressure (r = 0.321, p < 0.05) and pressure SD (r = 0.324, p < 0.05). In the leg region, perceived pressure relief was negatively correlated with contact area (r = −0.347, p < 0.05), and overall comfort was negatively correlated with mean pressure (r = −0.380, p < 0.05). No significant correlations were observed for the back region.
DISCUSSION
This study developed and validated a multi-level mattress comfort evaluation system that integrates subjective perception, objective interface pressure parameters, and a two-phase temporal structure. The system demonstrated good reliability (Cronbach’s α = 0.82) and content validity (CVI = 0.86), supporting its utility as a structured framework for research and product development.
A central methodological contribution is the explicit operationalization of comfort as a time-dependent experience. In the normal-weight group, the soft mattress produced favorable early impressions for conformability and pressure relief, whereas the medium mattress received higher later- phase overall comfort and fatigue relief. This divergence suggests that early “softness-related” sensations do not necessarily predict later comfort during sustained lying, highlighting the importance of standardized multi-time- point assessment.
Body type also moderated the comfort–pressure relationships. Although medium firmness yielded the highest later-phase mean comfort and fatigue relief in both groups, the overweight/obese group showed particularly strong associations in the shoulder region. The negative correlations between shoulder pressure metrics and fatigue relief imply that comfort for individuals with higher BMI may be constrained by localized load management at the shoulder and adjacent regions, even when the global firmness level is acceptable.
Finally, the results indicate that regional pressure parameters are more informative for design than whole-body metrics for explaining comfort variation. Whole-body indicators showed limited associations with overall comfort, whereas region-based metrics, especially at the shoulder and waist, demonstrated clearer and body-type-specific relationships. From a design
perspective, these findings support the use of zonal tuning strategies. For example, in normal-weight users, increasing effective load-sharing in the shoulder and back while maintaining stable waist support may benefit later-phase comfort. For overweight/obese users, reducing shoulder-region pressure concentration and managing lower-limb loading may be particularly important, potentially through targeted zoning based on a medium-firm baseline.
Limitations and Future Work This study used a modest sample (n = 28) and did not include underweight participants. Only the supine posture was assessed, and later-phase evaluation was limited to 30 min rather than overnight sleep. In addition, the correlation analyses were exploratory and did not explicitly model within-participant dependencies across mattress conditions; future work should consider mixed-effects models or repeated-measures correlation. Future work should include broader BMI categories, incorporate lateral postures, and combine the proposed framework with longer-duration monitoring and physiological measures (e.g., wearable EEG/EMG) to capture comfort dynamics under more ecologically valid sleep conditions. Integrating the framework with smart mattress sensing and adaptive control may also enable personalized comfort adjustment.
CONCLUSION
A hierarchical mattress comfort evaluation system was constructed and validated, comprising three dimensions, six primary indicators, and ten secondary indicators with a two-phase temporal structure. In a controlled laboratory study, medium firmness received the highest mean later-phase overall comfort and fatigue relief for both normal-weight and overweight/ obese participants. Whole-body pressure metrics showed limited associations with overall comfort, whereas regional pressure parameters, particularly in the shoulder and waist, demonstrated stronger and body-type-dependent relationships with subjective comfort. The proposed system supports standardized comfort assessment and provides design-relevant evidence for zonal mattress optimization tailored to body type.
ACKNOWLEDGMENT
The authors acknowledge Keeson Technology Co., Ltd. for providing equipment support and funding for this research. The authors also thank all participants for their time and contributions.
REFERENCES
Hou, J., and Zhang, Y. (2020). “The influence of mattress material on sleeping comfort of different age groups”, In: International conference on man-machine- environment system engineering. pp. 619–628.
Construction and Validation of a Multi-Level Evaluation System for Mattress Comfort 259 Hu, X., Gao, Y., Liu, K., Xiang, L., Luo, B., and Li, L. (2025). Surface Electromyographic
Responses During Rest on Mattresses with Different Firmness Levels in Adults with Normal BMI. Sensors 25. Khaleghipour, S., Masjedi, M., and Kelishadi, R. (2015). Circadian type, chronic fatigue, and serum IgM in the shift workers of an industrial organization. Advanced biomedical research 4. pp. 61. Lahm, R., and Iaizzo, P. (2002). Physiologic responses during rest on a sleep system
at varied degrees of firmness in a normal population. Ergonomics 45. pp. 798– 815. Min, S. N., Kim, J. Y., Kim, D. J., Park, Y. D., Kim, S. E., and Lee, H. S. (2015). Analysis of human body suitability for mattresses by using the level of psychophysiological relaxation and development of regression model. Journal of the Ergonomics Society of Korea 34. pp. 199–215. Mobeen, A., Kazim, H., and Ijaz, N. (2023). Effects of mattress firmness and usage
duration on low back pain: a hospital-based study from Lahore. J Soc Health Sci 2. pp. 34–42. Park, S. J., Lee, H.-J., Hong, K. H., and Kim, J. T. (2001). “Evaluation of Mattress for the Koreans”, In: Proceedings of the Human Factors and Ergonomics Society Annual Meeting, Vol. 45. pp. 727–730. Ren, L., Shi, Y., Xu, R., Wang, C., Guo, Y., Yue, H., Ni, Z., Sha, X., and Chen, Y.
(2023). Effect of mattress bedding layer structure on pressure relief performance and subjective lying comfort. Journal of Tissue Viability 32. pp. 9–19. Wu, J., Yuan, H., and Li, X. (2018). A novel method for comfort assessment in a supine sleep position using three-dimensional scanning technology. International Journal of Industrial Ergonomics 67. pp. 104–113. Zhu, Y., Zhang, X., Shen, L., and Fang, F. (2015). “Research on the Effect of
Zonal Spring Mattress on Spine Alignment and Mattress Comfort”, In: IEEE International Conference on Industrial Engineering and Engineering Management (IEEM). pp. 739–749.
LISTED IN THE AHFE DIGITAL BOOKSTORE CATALOGUE
Explore the complete digital volume
Human Factors and Ergonomics In Design
Read this individual research paper free through the original publisher, or explore the full digital proceedings book.
ISBN 978-1-964867-86-1
Explore this ISBN in the AHFE Bookstore ↗Listed in the July 2026 bookstore catalogue; search by ISBN to confirm current availability · Digital book purchase optional