Dan Högberga, Erik Brolinab, Lars Hansonbc (2020). Basic Method for Handling Trivariate Normal Distributions in Case Definition for Design and Human Simulation. In: Advances in Applied Digital Human Modeling. AHFE Open Access, vol. 11. https://doi.org/10.54941/ahfe100409
The paper describes a basic approach for the establishment of representative test persons when performing accommodation analyses and wanting to simultaneously consider normal variation in three variables. The main application is for defining a number of different manikins when performing ergonomics simulations for boundary case based accommodation analyses using digital human modelling tools. The method is also applicable when wanting to select representative people to be involved in user trials or to get direct design data. One objective is that the proposed method shall support inclusive design in that it is easy to adopt by non-experts in multivariate accommodation analyses, and accordingly reduce the amount of unsuitable univariate accommodation analyses. The paper introduces the reader to the area of interest, making links to previous research and current problems. The approach for the development of the basic method is explained. The confidence ellipse method is used for defining appropriate boundary manikins according to three selected key variables and desired accommodation level. The paper includes two examples that illustrate the method and compare the method to an alternative method.
Several methods have been developed for the consideration of anthropometric diversity in design. One example is A-CADRE (Bittner, 2000); a description of 17 body measurement combinations. The collection of such boundary cases aims to characterise the anthropometric variation among users in that each case represents an extreme but likely measurement combination (HFES 300 Committee, 2004). The concept behind the boundary case method is that, if the design will fit the boundary cases, people with less extreme body measurement combinations will be catered for by the design as well (Robinette, 2012). Meindl et al. (1993) describe a similar approach for identifying boundary cases using principle component analysis (PCA). PCA can be used to reduce the dimensionality (e.g. from 6 to 2 dimensions) but still represent most of the variance in the data (Jolliffe, 2002). The boundary case methodology procedure is described and evaluated in (Brolin et al., 2012a) and (Brolin et al., 2012b), including a general mathematical description of how to define boundary cases for any number of dimensions.
Design is more and more being performed by the use of computer support, where objects are designed in virtual worlds using computer aided design and engineering (CAD/CAE) tools. In line with this, digital human modelling (DHM) tools have been developed to support designers to consider ergonomic issues in virtual design processes (Duffy, 2009). The DHM tools typically facilitate the creation of human models of almost any sizes, and it becomes a task of the designer to decide the anthropometry of the human models to use in the design task.
Using methods such as the boundary case method for the consideration of anthropometric diversity when using DHM tools is likely to gain the ergonomic qualities of the object being designed, be it products, vehicles or workstations. Still, a study in Swedish vehicle manufacturing companies gave that it was common to use only a few human models as virtual test persons when designing workstations or evaluating manual work (Bertilsson et al., 2010). The study gave that, typically, a small female and a large male, according to stature, were considered as sufficient when performing ergonomics evaluations using DHM tools. This corresponds with findings reported in Robinette (2012). Such an approach mean that one key measurement is used (i.e. stature) and that two boundary cases are used (i.e. small female and large male). The study by Bertilsson et al. (2010) also gave that a common argument for this basic approach was the time needed for each extra virtual test person to be included in a simulation, and that this extra time was not considered worth the possible increase in accuracy in assessing and meeting targeted accommodation levels. Also, the study gave that the comprehension of the complexity of anthropometric diversity in design, and ways to deal with it, was rather scarce, which may also be a reason for the basic approach utilized in the industries studied. However, in essence this is no news and similar concerns have been highlighted for many years (Daniels, 1952; Roebuck et al., 1975; Ziolek and Wawrow, 2004; Robinette, 2012).
There may be many reasons for this gap in best practice, reported in literature by the research society, and observed industry practice, but traditions of how to perform DHM based simulations, and lack of DHM tool functionality and usability, are believed to be important causes. So, the question rises of how to support improved practice when using DHM tools in virtual design processes to consider anthropometric diversity. One way would be “to make it easier to do it right”. Indeed, DHM tools’ ability to, in theory at least, model any existing anthropometric configuration ought to be utilized when performing simulations of human-product interactions. One step in the direction to aid designers to consider anthropometric diversity is the approach taken when developing the IMMA digital human modelling software (Hanson et al., 2012), where the default manner when performing a simulation includes the definition of a family of anthropometrically representative virtual test persons (a manikin family that represents variance of a number of key measurements) followed by an automatic batch simulation using all these manikins.
Still, as this paper will show, one can consider three human body dimensions simultaneously by doing some basic mathematical treatments of the anthropometric data of the targeted user group. This approach is assumed to be applicable for any DHM tool being used, in the way that the method calculates extreme, but realistic, dimensions of three selected key measurements, in turn acting as input data for regression equations in the DHM tool, used to define the manikin’s other measurements. This as a basic but important step from using the univariate (one- dimensional) approach, which in most design purposes is poor in representing anthropometric diversity. In using the trivariate (three-dimensional) approach one can define a number of boundary manikins that concurrently represent variance in three key measurements, for example stature, sitting height and waist circumference, or shoulder-elbow length, forearm-hand length and forearm circumference, flexed etc. When selecting key measurements it is recommended to choose measurements that are critical in relation to the design task at hand, and strive for low correlation of these measurements, as not to comprise redundant information (Robinette, 2012). As an example, the selection of manikins in the DHM tool RAMSIS is based on the knowledge that the definition of the characterising property of length, proportion (ratio of sitting height over body height) and corpulence of an individual is sufficient to give an good prognosis of all other body dimensions for this person (Speyer, 1996; Bubb et al., 2006). In RAMSIS these properties are defined by the three key measurements stature, sitting height and waist circumference.
As noted, the approach defines boundary cases, and for some design tasks it might be relevant to define distributed cases instead, or as well. These categories of cases are further described in (HFES 300 Committee, 2004) and (Robinette, 2012). This paper develops the descriptions in (Högberg et al., 2011) and aims here to describe how to calculate boundary cases for trivariate normal distributions. The paper takes a pragmatic standpoint, directing its message towards practitioners and students using DHM tools for design purposes. The method can also be applied when wanting to select representative people to be involved in physical user trials or to get direct design data.
METHOD
The confidence ellipse method is used for defining appropriate boundary manikins according to three selected key dimensions and a desired accommodation level, here represented by the confidence region. Assuming that all three dimensions are normally distributed, which is appropriate in most cases (Pheasant and Haslegrave, 2006), general statistical methods are applied to analyse the data (e.g. Sokal and Rohlf, 1995; Brandt, 1999). The ANSUR anthropometric data is used in the examples (Gordon et al., 1989). This data is dated and limited in terms of representing “average people” (in that it is based on army personnel measurements), but considered relevant to use for showing principles in that it covers data of a large set of measurements (131) and individuals (1774 men and 2208 women). The presented method is applicable using any well founded anthropometric data though. To illustrate the characteristics of the data, Figure 1 shows a scatter matrix of the ANSUR data for stature and weight for male population. Figure 1 shows two dimensions for easy interpretation, while the following descriptions will cover operations for three dimensions.
Weight [X2] Stature [X1]
Weight [X2] Stature [X1]
Figure 1: Scatter plot matrix of stature (mm) and weight (kg) for ANSUR data for male population.
Figure available in the original PDF paper.
The mathematical procedure follows the descriptions in (Brolin et al., 2012a) and (Brolin et al., 2012b), where input data are: Mean values: μ=[μ1 μ2 μ3], Standard deviations: σ=[σ 1 σ2 σ3],
Correlation matrix: ρ=[
1 ρ12 ρ13 ρ21 1 ρ23 ρ31 ρ32 1 ] , and
Desired level of accommodation: P, where:0<P<1, e.g. P=0.95 for a 95% accommodation objective.
These input data are used to calculate the three dimensional confidence region, based on the definition of eigenvalues, eigenvectors and scaling the ellipsoid, as described in (Brolin et al., 2012a). Axis cases and box cases are then defined on the boundary of the ellipsoid as described in (Brolin et al., 2012a; Brolin et al., 2012b).
The outcomes from the described method is illustrated and compared to an alternative method in two examples.
RESULTS
A basic demonstrator was built by entering the equations into regular spreadsheet software (Microsoft Excel 2010) without any plugins required; making it easy to calculate and illustrate results, and simple to share. The demonstrator is based on using the female ANSUR anthropometric data (Gordon et al., 1989) and the user just needs to specify which three of the 131 available body measurements to consider and set a desired accommodation level. The spreadsheet draws the associated data from the database, determines the correlation coefficients, solves the calculations algebraically, defines the cases and creates the diagrams automatically. This facilitates easy testing of different measurement combinations and interpretation of outcomes. Output data is presented as value (in mm or kg), z-score (standard score) and percentile for the three selected measurements for 15 boundary cases, representing:
1 centre case (the average value of the trivariate distribution)
6 axis cases (located at the axis end of each eigenvector; where the axis meets the confidence ellipsoid)
8 box cases (located at the corners of the cuboid that spans the largest volume inside the ellipsoid) The output diagrams show, in the three orthogonal 2D-projections, the scatter plot (i.e. data on individuals in the ANSUR database, to show the relation between the artificially drawn cases and real people), the confidence ellipsoid and the location of all 15 cases. The cases are identified, and the diagrams are plotted, in the standardised space. This procedure is appropriate when comparing different normal distributions (Glenberg and Andrzejewski, 2007) and gives each distribution the same significance in the calculations.
Example 1 The first case illustrates the functionality of the demonstrator. The three measurements stature, sitting height and shoulder-elbow length are selected and the desired accommodation level is set to 90%. Figure 2 shows the input area of the spreadsheet where the white areas are where the user enters desired values. Each measurement has a unique number which is given when inspecting the anthropometric database within the spreadsheet. In the grey cells data for average values, standard deviations and the correlations matrix are given for the selection of measurements. As seen, in this case the recommendation to select measurements with low correlations is not followed. Some of the correlations are above 0.7 which is considered a high correlation in this context. Hence the result is a rather narrow ellipsoid (Figure 4). This selection of measurements is however made to facilitate comparisons with results in (Brolin et al., 2012a).
Figure 2: Input area. White cells are entered by the user and grey cells are given automatically.
Figure available in the original PDF paper.
Figure 3 shows the output area with data for the 14 boundary cases (6 axis and 8 box) and the average case, plus the minimum and maximum value for each measurements among the 15 cases.
Figure 3: Output area. Data for the 15 cases and min and max values.
Figure available in the original PDF paper.
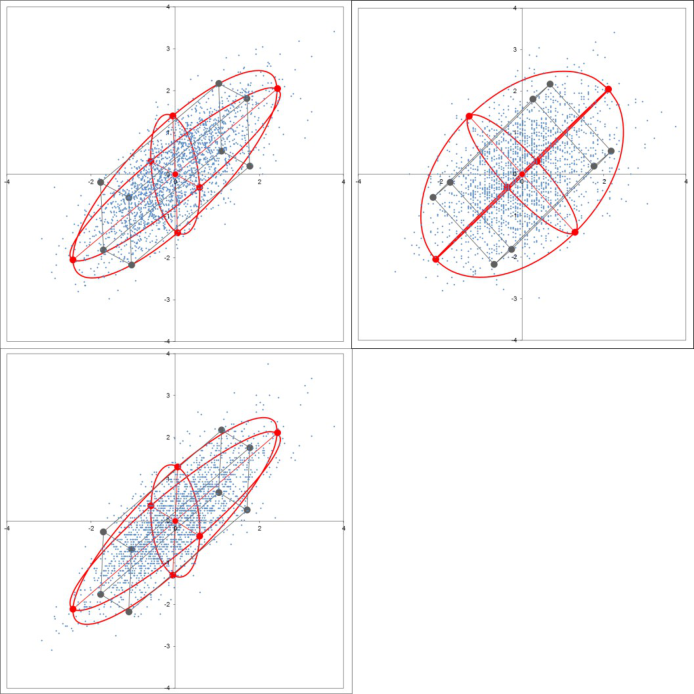
Figure 4 shows the corresponding ellipsoid in standardised space and the 15 cases shown as dots (centre and axis cases in red dots and box cases in grey dots). The spreadsheet gives the three orthogonal projections. The scatter plot illustrates how approximately 10% of the dots (individuals) are located outside the ellipsoid, consistent with the selected accommodation objective of 90%.
Figure 4: The confidence ellipsoid in the 3 orthogonal projections and the 15 cases (scale in standard scores).
To illustrate, entering the values of stature, sitting height and shoulder-elbow length (Figure 3) in the DHM tool Jack 7.1 (Siemens, 2011) gives manikins as shown in Figure 5, here called a manikin family. All other manikin measurements are regressed in Jack from the entered values. Hence, in this case these manikins represent a suggested virtual test group to use for design purposes in ergonomics simulations. The designer may still choose a subset of the manikins if a fewer number of test manikins is wanted, e.g. the 6 axis cases or the 8 box cases.
1 2 3 4 5 6 7 8 9 10 11 12 13 14 15
modelled in Jack.
Figure 5: Manikin family of 15 members (1 average, 6 axis and 8 box cases) modelled in Jack.
Figure available in the original PDF paper.
In Brolin et al. (2012a) the 6 axis cases in the manikin family (Figure 5, manikins 2-7) are applied to a task of extracting values of required adjustment ranges in the design of an office workplace, including a comparison of the outcomes from using four alternative ways to define boundary cases that represent anthropometric diversity. The study in Brolin et al. (2012a) shows that different ways of establishing representative virtual test persons influence the predicted design dimensions related to meeting accommodation objectives.
Example 2 For some design tasks it is possible to conclude that, for certain dimensions, it is enough to use the largest or smallest boundary case for getting data for the design task. An example of this is given in Robinette (2012), in the context of seated workstation design, where the definition of the minimum width of a seat only requires a large case related to hip-breadth, sitting to get design data. In the example in Robinette (2012), three critical dimensions are identified: eye-height, sitting, buttock-knee length and hip-breadth, sitting, and the desired accommodation is set to 90%. The method illustrated in Robinette (2012) is based on meeting the 90% accommodation objective by creating four boundary box cases using a bivariate (two dimensional) 90% confidence ellipsoid for eye-height, sitting and buttock-knee length and selecting the maximum value of hip-breadth, sitting. This is a sensible approach. However, sometimes it may be hard for a designer to know how and when to draw such conclusions of how to handle key dimensions. Of that reason, the method presented in Robinette (2012) (here called Approach 1) is compared with the trivariate approach presented in this paper (here called Approach 2). The objective is to compare the different case dimensions from using the two approaches of meeting the accommodation objective (90% in this case) for three key measurements. Female anthropometric data from ANSUR data is used in this example. Table 1 gives values (in mm and percentile) for dimensions of the 4 box cases using Approach 1 (2D confidence ellipse + max value for third dimension) and Table 2 the values for the 8 box cases using Approach 2 (3D confidence ellipsoid).
Table 1: Dimensions for the 4 box cases using Approach 1.
Table available in the original PDF paper.
Cases 1 2 3 4 Min Max mm 750 669 728 809 669 809 eye- height,
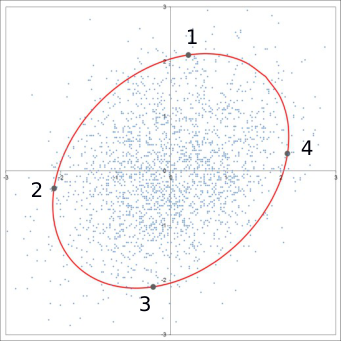
Figure 6: Ellipse and 4 cases (Approach 1, left), Ellipsoid and 8 box cases (Approach 2, right) (scale in standard scores).
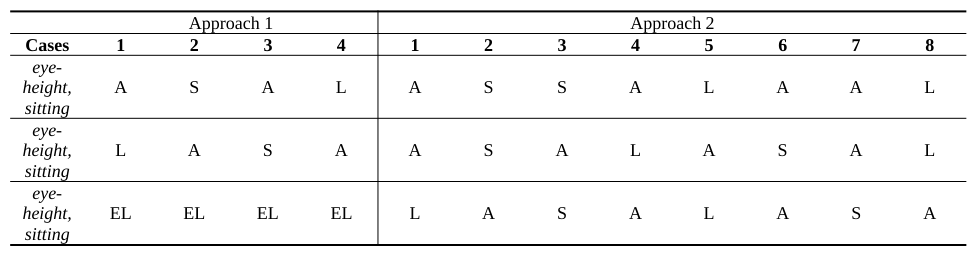
By studying the values in Table 1 and the left image in Figure 6 it is possible to see how the equations spread out the cases on the boundary of the ellipse. Correspondingly, by studying the values in Table 2 and the right image in Figure 6 it is possible to see how the equations spread out the cases on the boundary of the ellipsoid. Table 3 shows how the box cases in Table 1and Table 2 represent types of combinations of eye-height, sitting, buttock-knee length and hip-breadth, sitting stated in the approximate terms: Extremely large (EL) (seeing z>3 as extremely large), Large (L), Average (A) (seeing -1.2<z<1.2 as average) and Small (S).
Table 3: Combinations of approximate types per approach.
Table 4 shows difference between maximum and minimum value per dimension for each approach, in order to illustrate in what way the two different approaches represent the range per dimension (assuming Approach 1 accommodates from min to max value in the ANSUR database for hip-breadth, sitting).
Table 4: Range per dimension per approach.
Table available in the original PDF paper.
Range Approach 1 Approach 2 eye-height, sitting mm 140 145 z-score 4.24 4.34 %-ile 96.6 97.0
The probability levels that the min and max values in Table 1 and 2 answer to, according to two separate anthropometric software, was calculated by using the multidimensional analysis functionality in: 1) PeopleSize 2008 Professional Version 2.02 (PeopleSize, 2009) and 2) RAMSIS BodyBuilder Version 1.4-3.8.31 (Human-Solutions, 2010) (Table 4). For the BodyBuilder calculation sitting height was used rather than eye-height, sitting due to non- availability of the measurement in the software, but since these measurements show high correlation (ρ=0.997) the value of approximate level of combined accommodation is argued to be legitimate. Correspondingly, hip-breadth was used rather than hip-breadth, sitting (ρ=0.898). Table 4 shows the same value for Approach 1 and Approach 2 from PeopleSize and BodyBuilder respectively, which indicates that both Approach 1 and Approach 2 offer a similar level of accommodation, which is as expected since both approaches claim to accommodate the same proportion of the population, i.e. 90%. The reasons why both PeopleSize and BodyBuilder indicates a higher level of accommodation (i.e. 94% and 93%) is hard explain since it is not clear how the two software do the calculations and what correlation data they use. However, by the means of a script that counted the percentage of the 2208 subjects that were encapsulated by the 90% ellipsoid gave that 90.53% were encapsulated in the setup in Example 2 (and, to compare, 90.22% in Example 1), indicating that the mathematical methodology works well.
CONCLUSIONS AND DISCUSSION
Table 4 shows how the trivariate method (Approach 2) represent a more even range per measurement compared to Approach 1, as expected since Approach 1 is based on assuming the maximum value for one dimension. Using maximum value is sensible since it should mean that all people would be accommodated. Still, as design is a complicated optimisation task of finding the best overall solution that meets many, often conflicting, requirements, the objective to accommodate all users (though in Approach 1 only related to one certain dimension) may be a costly attempt, or causing sub-optimisation since it could lead to drawbacks related to other product qualities. It is argued that the trivariate approach (Approach 2) offers a more controlled way to meet the accommodation objective compared to Approach 1 in this example. Also, the suggested manikin family of Approach 2 is a more design task neutral, hence more general, approach than Approach 1 in that the family better represents the actual variation within the population compared to the cases suggested by Approach 1, which was devised to suit a certain design task. This is obvious by looking at how the two methods differ in representing variation in hip-breadth, sitting. This highlights a fundamental issue of appropriate approach when defining cases and get design data. Should the cases be selected according to the design task, or rather selected to represent the general variation within a population? The latter would resemble a situation when a company has established a well-founded test group that is always recruited to test products being designed, or benchmarked, regardless of type of product or issue to assess. This way of reasoning can also be applied when using DHM tools, where a company may create a manikin family that always will act as their standard virtual test group.
An option would be to mix Approach 1 and 2, i.e. to use a three dimensional confidence ellipsoid and one minimum/maximum value, and thereby consider four dimensions in the design. Another approach would be to use
DHM tools to perform large numbers of ergonomics evaluations associated to a specific design task, e.g. related to issues like fit, reach, and comfort, where the software identify which cases within a population (on the boundary and distributed) that experience the largest problems or draw the most extreme design data. Such an advanced method, called Adaptive Ergonomic Search (AES), is presented in Mårdberg et al. (2012).
This paper describes a more basic approach compared to AES and PCA based methods, but argues that the proposed trivariate method is advantageous compared to approaches based on the use of univariate percentile data in design, and an important step towards enhanced accuracy in meeting desired levels of accommodation, e.g. when using DHM tools for the design of products and workplaces. This paper presents a way to calculate boundary cases on a three dimensional confidence ellipsoid by the means of regular spreadsheet software, providing a basic, low-cost and practical tool. Most computer users have access to regular spreadsheet software (such as MS Excel) making the file easy to distribute, e.g. to practitioners and students that do design where there is a need for the consideration of anthropometric diversity, which indeed is common in design for creating solutions that fit targeted users. An obvious restriction in the demonstrator tool is that only female anthropometrics is considered, and there are plans to add the option to also consider male data. The three dimensional approach is basic compared to more advanced methods, but still an important step forward compared to using the univariate approach for multidimensional design problems. Also, if the three key dimensions are selected thoughtfully, a good prediction of an individual’s all other measurements can be drawn (Speyer, 1996; Bubb et al., 2006). Another advantage with the three dimensional approach, where each dimension represent an actual body dimension, is that it is easier to interpret the ellipsoid and the location of the cases, compared to a hyper-ellipsoid of four dimensions of more. Also, having the ellipsoid plotted in the space of real dimensions makes it easier to interpret the ellipsoid and its cases, compared to using PCA which converts and transforms the data to a new coordinate system based on principal components.
Having the ellipsoid plotted together with a scatter plot of real individuals is argued to be important in order to illustrate to the tool user how the ellipsoid encapsulates approximately the percentage of the dots set by the value of the accommodation objective. Also, the scatter plot is argued to be important to highlight that people that are located outside of the ellipsoid by the set accommodation objective are likely to be excluded by the final design. Hopefully this will trigger discussions within the design team, and with managers, of appropriate accommodation levels. Setting an accommodation level of 90% is common, but still that means that 1 of 10 persons is not explicitly considered in the design. Porter and Porter (2001) consider the 90% accommodation objective as somewhat out-of- date given the concern for quality of life, high productivity and safety. Aiming for higher accommodation levels complies with the concept of inclusive design, which has positive implications both on life-quality for more people but also opens opportunities to expand markets by satisfying more users by the design (Waller et al., 2013). The reasoning behind the inclusive design approach is that designers should try to include users rather than exclude users when designing products, systems and environments; it encourages an attitude of “what if we design like this, then we would include these user groups as well, rather than exclude them”. The issue of when someone actually is accommodated or not by a design is however often not so precise, but rather a multifaceted “grey area issue” (Clarkson et al., 2013). Hence, accommodation when interacting with a product or workstation is often within a range that can be portrayed: from works well - being frustrated - having difficulty to exclusion (not able to use/perform task/interact). Indeed, the approach presented in this paper does not claim to ensure that someone with anthropometry that would be located within the ellipsoid would be accommodated and that someone outside the ellipsoid would be non-accommodated. Firstly, there may be other measurements than the three measurements, selected on the assumption that they would limit accommodation, which will cause exclusion. Secondly, there may be links between human anthropometry and accommodation of using an object that is not captured when using this method, which would rather be captured by observing digital human models or real people interacting with the object being designed. It may, of course, also be other issues than anthropometry that cause exclusion. Still the presented method is claimed to be a substantial improvement from the common univariate 5 percentile female to 95 percentile male approach, in that the method supports the consideration of multidimensional anthropometry issues in design. Porter et al. (2002) argues that, if user groups are to be excluded of one reason or another, that outcome ought to be the result of a conscious design decision rather than for example an effect of poor information, knowledge or consideration within the design team, and that designers need support, e.g. tools and methods, to enable this. The method presented in this paper is a contribution towards that call.
ACKNOWLEDGEMENTS
This work has been made possible with the support from VINNOVA in Sweden, within the FFI programme, and by the participating organisations. This support is gratefully acknowledged.
REFERENCES
Bertilsson, E., Svensson, E., Högberg, D., Hanson, L. (2010), ”Use of digital human modelling and consideration of anthropometric diversity in Swedish industry”. Proceedings of the 42nd annual Nordic Ergonomic Society Conference, Stavanger, Norway, September 6-8, ISBN 9788299574723. Bittner, A.C. (2000), “A-CADRE: advanced family of manikins for workstation design”. XIVth Congress of IEA
and 44th Meeting of HFES, San Diego, pp.774-777. Brandt, S. (1999), “Data Analysis - Statistical and Computional Methods for Scientists and Engineers, 3rd edition”.
Springer-Verlag, New York, ISBN 0387984984. Brolin, E., Högberg, D., Hanson, L. (2012a), ”Description of boundary case methodology for anthropometric diversity consideration”. International Journal of Human Factors Modelling and Simulation, 3, pp. 204-223. Brolin, E., Högberg, D., Hanson, L. (2012b), ”Using experimental design to define boundary manikins”. Work,
41(1), pp. 4598-4605. Bubb, H., Engstler, F., Fritzsche, F., Mergl, C., Sabbah, O., Schaefer, P., Zacher, I. (2006), “The development of RAMSIS in past and future as an example for the cooperation between industry and university”. International Journal of Human Factors Modelling and Simulation, 1, pp. 140-157. Clarkson, P.J., Waller, S., Cardoso, C. (2013), “Approaches to estimating user exclusion”, Applied Ergonomics,
http://dx.doi.org/10.1016/j.apergo.2013.03.001 Daniels, G.S. (1952), “The average man?” Ohio, Wright Air Development Center, Wright-Patterson Air Force Base.
Technical Note WCRD, 53-7. Duffy, V.G. (2009), “Handbook of Digital Human Modeling”, Taylor & Francis Group, Boca Raton. Glenberg, A., Andrzejewski, M. (2007), “Learning from Data: An Introduction to Statistical Reasoning, 3rd ed.”.
Routledge Academic, New York, ISBN 9780805849219. Gordon, C.C., Churchill, T., Clauser, C.E., Bradtmiller, B., McConville, J.T., Tebbetts, I., Walker, R.A. (1989), “1988 Anthropometric Survey of U.S. Army Personnel: Methods and Summary Statistics”. Technical Report Natick/TR-89-044. U.S. Army Natick Research, Development and Engineering Center, Natick, MA. Hanson, L., Högberg, D., Söderholm, M. (2012), “Digital test assembly of truck parts with the IMMA-tool”. Work:
A Journal of Prevention, Assessment and Rehabilitation, Vol. 41, Suppl.1, pp. 2248-2252. Högberg, D., Bertilsson, E., Hanson, L. (2011), ”A basic step towards increased accommodation level accuracy when using DHM tools”. Proceedings of: DHM 2011, First International Symposium on Digital Human Modeling, Lyon, France. HFES 300 Committee. (2004), “Guidelines for using anthropometric data in product design”. Santa Monica: Human
Factors and Ergonomics Society. ISBN 0945289235. Human-Solutions. (2010), “RAMSIS BodyBuilder Version 1.4-3.8.31”. Kaiserslautern, Germany, Human Solutions GmbH. Jolliffe, I. (2002), “Principal Component Analysis, 2nd ed.”, Springer, New York. Meindl, R.S., Hudson, J.A., Zehner, G.F. (1993), “A Multivariate Anthropometric Method for Crew Station
Design”. Crew Systems Directorate, Human Engineering Division, Armstrong Laboratory, Wright-Patterson Air Force Base, Ohio. Technical Report AL-TR-93-0054. Mårdberg, P., Carlson, J.S., Bohlin, R., Hanson, L., Högberg, D. (2012), “Using Ergonomic Criteria to Adaptively Define Test Manikins for Design Problems”. Advances in Applied Human Modeling and Simulation. Duffy, V.G. (Ed.). CRC Press. pp. 265-274, ISBN 978-1-4398-7031-0 (print), ISBN 978-1-4398-7032-7 (eBook). PeopleSize. (2009), “PeopleSize 2008 Professional”. Melton Mowbray, UK, Open Ergonomics Ltd. Pheasant, S., Haslegrave, C.M. (2006), “Bodyspace: Anthropometry, Ergonomics and the Design of Work, 3rd ed.”,
Taylor & Francis, Boca Raton. ISBN 0415285208. Porter, J.M., Porter, S.C. (2001), “Occupant accommodation: an ergonomics approach”. An Introduction to Modern Vehicle Design. J. Happian-Smith, Ed. London, Butterworth-Heinemann, pp. 233-275. Porter, J.M., Case, K., Gyi, D.E., Marshall, R., Oliver, R.E. (2002), “How Can We ‘Design for All’ If We Do Not
Know Who is Designed Out and Why?”, XVI Annual International Occupational Ergonomics and Safety Conference, Toronto, Canada, ISOES. Robinette, K.M. (2012), “Anthropometry for product design”. Handbook of Human Factors and Ergonomics, 4 th ed., G Salvendy (Ed.): John Wiley & Sons, Hoboken, pp.330-346. ISBN 9780470528389. Roebuck, J.A., Kroemer, K.H.E., Thomson, W.G. (1975), “Engineering Anthropometry Methods”. New York, John
Wiley & Sons. Siemens. (2011), “Jack Version 7.1”, Siemens Product Lifecycle Management Software Inc., California, USA. Sokal, R.R., Rohlf, F.J. (1995), “Biometry: the principles and practice of statistics in biological research, 3rd ed.”.
W. H. Freeman and Co, New York, ISBN 0716724111. Speyer, H. (1996), “On the definition and generation of optimal test samples for design problems”. Kaiserslautern, Human Solutions GmbH. Waller, S., Bradley, M., Hosking, I., Clarkson, P.J. (2013), “Making the case for inclusive design”, Applied
Ergonomics, http://dx.doi.org/10.1016/j.apergo.2013.03.012 Ziolek, S.A., Wawrow, P. (2004), “Beyond Percentiles: An Examination of Occupant Anthropometry and Seat Design”. Society of Automotive Engineers, SAE Technical Paper 2004-01-0375, Warrendale.
LISTED IN THE AHFE DIGITAL BOOKSTORE CATALOGUE
Explore the complete digital volume
Advances in Applied Digital Human Modeling
Read this individual research paper free through the original publisher, or explore the full digital proceedings book.
ISBN 978-1-4951-2094-7
Explore this ISBN in the AHFE Bookstore ↗Listed in the July 2026 bookstore catalogue; search by ISBN to confirm current availability · Digital book purchase optional