Hiroshi Furukawa (2021). Pedestrian Navigation Guidance for Elderly People’s Safe and Easy Wayfinding. In: Advances in Human Aspects of Transportation: Part I. AHFE Open Access, vol. 15. https://doi.org/10.54941/ahfe100636
In order to reduce anxiety of pedestrian navigation users, we have proposed a route planning algorithm, which weighs user’s difficulty of locating own current position as well as total physical distance of courses. The cost function for evaluating routes is expanded by adding elapsed time of locating each intersection to the original cost of route distance. The elapsed time at an intersection is estimated based on valuation functions of effectiveness of landmarks. The functions were constructed based on data collected through cognitive experiments with younger participants. The fundamental validity of the proposal method was confirmed through practical experiments. The aim of this study was to extend the object of the navigation guidance method to elderly people, as well as younger people. Considering the degradation of cognitive functions of elderly users, we modified three functions: the valuation functions for recognizability of landmarks, the valuation function of landmark’s effectiveness, and the cost function for route planning. Three cognitive experiments were conducted to acquire actual data for the modification. The results indicate that the functions acquired are quite fit to the data of the experiments, and suggest that the modified method is useful for estimating walking time for routes by elderly users.
Anxiety of users of pedestrian navigation system is the theme of our work. This study focused on modifications of our guidance method for elderly users.
Pedestrian navigation guidance is one of the widespread services provided by mobile devices, e.g., NAVITIME Japan (n.d.), EZ Navi Walk (n.d.). Even though performance of the function has been improved with GPS and high information and communication technologies, it was reported that users sometimes feel anxiety because of low accuracy of the position estimation and delay of updating of navigation display (Tatenami et al., 2006). In areas with many high buildings, the accuracy of position estimation by GPS can be low when a communication state with a satellite is harmed by the obstacles. The incorrect information might make it difficult for users to locate their position. When the precise location is not given on navigation display, geographical information about the area is the invaluable cues for users to locate their position.
Because of the limitations on the memory capacity and the processing speed of mobile phones, restriction arises to the degree of details and the amount of information of a map represented on the display. In those situations, there is a possibility that useful landmarks are not displayed on the map, or the form of roads will be simplified. This lack of information may harm user’s estimation of his/her current location. Additionally, it is reported that when a user cannot find landmarks, especially familiar ones, that are displayed on the map, he/she falls anxiety because he/she cannot have firm belief in estimation of own current location (Tatenami et al., 2006).
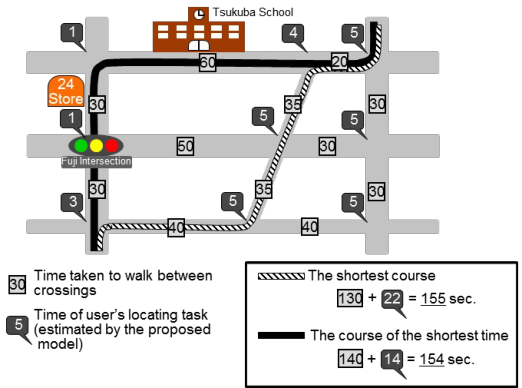
The purpose of our work is to develop a pedestrian navigation aid to reduce the anxiety of users (Furukawa and Uto, 2012, Furukawa and Nakamura, 2012, Furukawa and Nakamura, 2013). A route planning algorithm is proposed, which weighs user’s difficulty (or easiness) of locating own current position as well as total physical distance of courses. Figure1 depicted the basic idea of the method. We focused on the roles of useful landmarks at the locating task. Two types of valuation functions are proposed to estimate effectiveness of various landmarks. The one is a valuation function for their recognizability and the other visibility. The fundamental validity of the proposal method was confirmed through experiments, where younger people attended as participants.
The aim of this study is to extend the object of the navigation guidance method to elderly people, as well as younger people. Since the degradation of cognitive functions especially occurs as a result of normal aging in senile state (Park, 2000), we focus on the difference in cognitive ability with the rising generation. Three cognitive experiments were conducted to acquire actual data for the expansion of the estimation models. The models modified were the valuation functions for recognizability of landmarks, the valuation function of landmark’s effectiveness, and the cost function for route planning.
Figure 1. The basic idea of the proposed method considering the effectiveness of landmarks, and the conventional method considering physical distance of a course.
RELATED RESEARCHES Different types of route selection methods are proposed for pedestrian navigation system to meet the needs of users. Miura and his colleagues (2011) focused on the condition about street illuminations. They proposed a method evaluating the unsafe cost of the illumination and the cost of route distance. Akasaka and Onisawa (2008) proposed a method reflecting individual preference for route selection. User’s satisfaction degree of a road is evaluated by fuzzy measures, and used as one of the costs for route selection. In the same way, the method proposed in this paper uses multi-objective evaluation method, where the cost is defined as the easiness of locating user’s current position and the distance of routes.
Some studies have conducted about evaluation methods of landmark’s effectiveness for pedestrian navigation systems. Nakazawa and his colleagues (2008) proposed a method of evaluating landmark’s effectiveness based on the frequency used for available navigation maps. They collected guide maps from web pages and magazines, and counted frequency of the appearance of landmarks in attribute classification, such as a restaurant and a convenience store. The frequency is defined as an index of the cognitive ease of finding landmarks. An issue is that the relationships between the effectiveness of landmarks and the frequency of appearance is not clearly explained or confirmed. There is a possibility that the correlation is weak. For example, the study reported that the frequency for business complexes or apartment buildings is high (Nakazawa et al., 2008). On the other hand, the effectiveness of the landmarks may not be high enough to achieve user’s navigation tasks because of the low salience or low uniqueness. We are trying to develop a rational and feasible method for quantitative evaluation of the landmark effectiveness.
Caduff and Timpf (2008) proposed a conceptual framework for assessing the salience of landmarks based on perceptual and cognitive ability of human. The salience of geographic features is defined as a three-valued vector, whereby the components capture perceptual, cognitive, and contextual aspects of geographic objects. This type of theoretical studies can be used to complement our proposed method which is developed through empirical studies about a model of user’s evaluation of the landmark effectiveness.
A ROUTE PLANNING METHOD BASED ON FUNCTIONS OF LANDMARK'S EFFECTIVENESS Authors proposed a route planning algorithm which weighs user’s easiness of locating own current position (Furukawa and Uto, 2012, Furukawa and Nakamura, 2012, Furukawa and Nakamura, 2013). The easiness is quantitatively estimated using two types of valuation functions: valuation functions for the recognizability and visibility.
Recognizability of Landmarks The recognizability is an index that shows how easy for users to find out a landmark which depicted on navigation maps. For example, it must be high when a store has a shining signboard, or when the appearance of a store is well known for users. Also, the index must be negatively correlated with distance between a landmark and user’s position. The degree of influence on change of the distance must be different with different kinds of landmarks. It becomes difficult to recognize a small store like a convenience store being located in the position away from user’s current location.
The valuation model for recognizability was constructed through several cognitive experiments (Furukawa and Uto, 2012). Six types of landmarks were selected as useful cues for locating current position based on results from our cognitive experiments. These are convenience stores, restaurants, gasoline stations, bank buildings, public facilities, and school buildings. For each type of landmarks, a regression line was determined as a valuation function for the recognizability, which shows relationships between recognizability and the distance.
Visibility of Landmarks The recognizability index is argued about the easiness of finding a landmark assuming that it is within user’s view. The visibility is defined as possibility that a landmark is in sight of users (Furukawa and Uto, 2012). It must be low when there are many high buildings between the landmark and the users. To consider a situation that a landmark is concealed by other buildings from user’s view, two physical features are defined as factors in the visibility of landmarks: denseness of buildings around user’s current position and depth of a landmark from its nearest road.
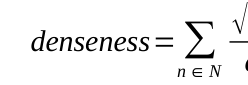
The first factor denseness is defined as a function of each base area of buildings around user’s position and distance to the buildings from user’s position, as described in Eq. (1).
√An
(1)
Equation reproduced from the original PDF.
where n: a building n which is within fixed distance from user’s current place, An: the base area of a building n [m2], dn: the distance from user’s current place to a building n [m].
The second factor depth is defined to consider a situation that a user can see a landmark on the road which extends from his/her current location.
The valuation function for visibility is modeled using a logistic function (Eq. (2)).
visibility= 1 1+exp[ A (x−By )−C ] (2) where x: the depth of a landmark from its nearest street [m], y: denseness of buildings around user’s current position, A: a coefficient for the depth, B: a coefficient for the denseness, C: a bias, which represents the rapidly changing point of the function according to the depth.
To acquire data for construction of the valuation function for visibility of each type of landmarks, visual confirmation investigations of landmarks were conducted using the Street View function of Google map (Furukawa and Uto, 2012).
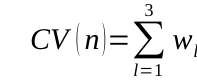
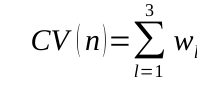
Valuation Function of Landmark’s Effectiveness In this method, it is thought that the easiness of locating current position at a place is equivalent to the total effectiveness of landmarks at the place (Furukawa and Uto, 2012). The valuation model of the total effectiveness is defined as Eq. (3), based on the valuation functions of recognizability and visibility (Furukawa and Nakamura, 2012).
'(l)×V (l)+δ (3)
3 wl C
Equation reproduced from the original PDF.
where CV(n): the total effectiveness of landmarks at the place n, l: the lth nearest landmark which is within fixed distance from the place n, C’(l): the basic effectiveness of the landmark l at the place, V(l): the visibility of landmark l where V(x) is the valuation functions of visibility for the landmark x, wl: coefficients for the effectiveness of landmark l, [Equation or mathematical symbol available in the original paper PDF]: a bias, C(l): the recognizability of landmark l where C(x) is the valuation functions of recognizability for the landmark x, dl: the distance from user’s current place to the building l [m], [Equation or mathematical symbol available in the original paper PDF]: a coefficient for the effectiveness of the landmark l, [Equation or mathematical symbol available in the original paper PDF]: a coefficient for the distance of the landmark l, [Equation or mathematical symbol available in the original paper PDF]: a bias. The product of the basic effectiveness and visibility functions, C’(l) x V(l), synthetically evaluates the easiness of finding out a landmark when it is actually within user’s view. As the results of an experiment, the values of the coefficients wl are 0.958, 0.004, -0.007, and the bias [Equation or mathematical symbol available in the original paper PDF] is 0.194 for younger people. The values of the coefficients [Equation or mathematical symbol available in the original paper PDF] and [Equation or mathematical symbol available in the original paper PDF] are 1.514, 0.028, and the bias [Equation or mathematical symbol available in the original paper PDF] is -2.174.
Cost Function and Route Planning Algorithm In the general navigation systems, path planning is performed using the shortest path planning algorithm by Dijkstra (Dijkstra, 1959). In this method, the cost function for evaluating routes is expanded by adding elapsed time of user’s locating task at each intersection to the original cost (Furukawa and Uto, 2012, Furukawa and Nakamura, 2013). The elapsed time at each intersection is estimated based on the valuation function of landmark’s effectiveness Eq. (3). When the cost between nodes m and n is defined as d(m,n) in the Dijkstra method, the proposed cost, dn(m,n), can be described as Eq. (5) (Furukawa and Nakamura, 2013).
dn (m,n )={d (m ,n)+dcv(n),∧the∩nis guided
¿ turn¿d (m,n) ,∧the∩nis g (5) The dcv(n) is the additional cost which considers the elapsed time of user’s locating task at the place n. Eq. (6) shows the relationships between the elapsed time and the total effectiveness of landmarks at the place n.
dcv (n)={
ω,∧CV (n)<1.0 ω/CV (n),∧otherwise (6) where CV(n): the total effectiveness of landmarks at the place n (Eq. (3)), [Equation or mathematical symbol available in the original paper PDF]: a coefficient. The values of the coefficients [Equation or mathematical symbol available in the original paper PDF] implies the maximum time for user’s locating task, and is 23.0 [sec.] for younger people.
VALUATION FUNCTIONS OF RECOGNIZABILITY OF LANDMARKS FOR ELDERLY USERS The estimation models for recognizability of landmarks for elderly people were constructed through several cognitive experiments. This section explains the experiments and the valuation functions as the results of them.
Method
The main tasks of participants were discovery of a landmark depicted on a digital map and evaluation of the easiness of the discovery task for each trial. The values evaluated were used as real data to the recognizability of landmarks, which is the estimated value by the valuation function.
Types of landmarks and distance to landmarks were defined as factors to construct the valuation function of the recognizability of landmarks. Six types of landmarks were selected (i.e., convenience stores, restaurants, gasoline stations, bank buildings, public facilities, and school buildings) and three different distances were set in this study (10m, 50m, and 100m).
There were two types of experiments in this study. The first experiment was conducted in real situation (field condition). The participants were asked to find out a landmark at several areas in Tokyo. Because the first experiment is time-consuming, simulated situation using a large-sized display was used for the second experiment (display condition). The participants were asked to find out a landmark from a photo displayed on the LCD.
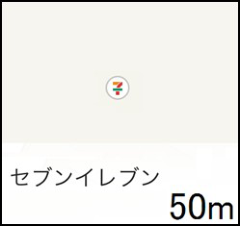
In both experiments, participants were asked to find out a landmark indicated on a smartphone (Figure 2). The display shows the icon and the name of a landmark, and the distance of the landmark. Several different types of conditions were evaluated in the experiments. After each of the discovery task, the participants were asked to evaluate the easiness of the task using five-level index, where Level 5 is “very easy” and Level 1 is “difficult.” We have confirmed that there is no significant difference between the results of tasks between real situation and simulated simulation. Based on this result, the data from the first and second experiments was analyzed altogether in this study.
Figure 2. An example of the display indicating a landmark and its information. Human Aspects of Transportation I (2021)
Procedures In the first experiment with field condition, ten paid participants (six male and four female) took part. Their ages are from 67 to 77, and the average is 71.0. The participants were guided by the experimenter to the task point, and asked to conduct the tasks. The task points were 24, which are different areas in Tokyo. The experiment was done in daytime.
Twenty paid participants (ten male and ten female) took part in the second experiment (display condition). Their ages are from 62 to 75 (the average: 69.9). Twenty-four trials were conducted, where twenty-four photos taken in daytime were used as a scene from the current place.
The data acquired in the experiments were: the numbers of the succeeded discovery tasks, subjective evaluation of the easiness of the discovery task (oral relies), and the elapsed time of the discovery task.
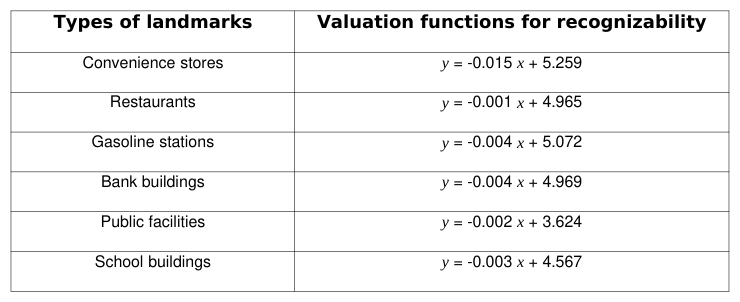
Modeling For each type of landmarks, a regression line was determined as a valuation function for the recognizability, which shows relationship between recognizability and the distance. The functions are summarized in Table 1, where x is the distance of a landmark from user’s current place [m], and y is the estimated value of recognizability of the landmark. These functions are used to estimate the recognizability of landmarks at route planning phase.
Table 1: The valuation functions of recognizability of landmarks for elderly users Types of landmarks Valuation functions for recognizability
VALUATION FUNCTIONS OF LANDMARKS' EFFECTIVENESS FOR ELDERLY USERS This section shows an empirical study conducted to acquire actual data for modeling of valuation functions for effectiveness of landmarks for elderly people.
Method
The main tasks of participants were estimation of their current location using a digital map and evaluation of the easiness of the locating task for each trial. The values evaluated were used as real data to the easiness of locating current position at a place, which is estimated by the valuation functions.
There were two types of experiments in this study. The first experiment was conducted in real situation (field condition). The participants were asked to conduct the tasks at several areas in Tokyo. Simulated situation using a large-sized display was used for the second experiment (display condition). The participants were asked to estimate their current location by looking the photo displayed on the LCD and a map. Several different types of conditions were evaluated in the experiments. We have confirmed that there is no significant difference between the results of tasks between real situation and simulated simulation. Based on this result, the data from the first and second experiment was analyzed altogether in this study.
In both experiments, participants were asked to estimate their current location with a digital map displayed on a smartphone. Six kinds of landmarks were depicted on the digital map, which are used in the proposed route planning method (i.e., convenience stores, restaurants, bank buildings, gasoline stations, school buildings, and public buildings). The current position and the scene were carefully selected that a user was able to see the all landmarks depicted on the digital maps. Therefore, the visibility of each landmark was set “1.0” in the estimation of the total effectiveness.
After each of the locating trial, the participants were asked to evaluate the easiness of the task using five-level index, where Level 5 is “very easy” and Level 1 is “difficult.”
Procedures Ten paid participants (five male and five female) took part in the both experiments. Their ages are from 68 to 75 (the average: 71.4).
In the first experiment with field condition, the participants were guided by the experimenter to the task point, and asked to conduct the task. The task points were nine, which are different areas in Tokyo. The experiment was done in daytime. Twenty-four trials were conducted in the second experiment, where twenty-four photos taken in daytime were used as a scene from the preselected place.
The data acquired in the experiments were: the numbers of the succeeded location tasks, subjective evaluation of the easiness of the locating task (oral replies), landmarks used by the participant at the locating task (oral replies), and the elapsed time of the task.
Modeling of Valuation Functions of Effectiveness of a Landmark This section shows a modeling process of the proposed valuation function of effectiveness of a landmark, Eq. (4), for elderly users, based on the data acquired by the cognitive experiments.
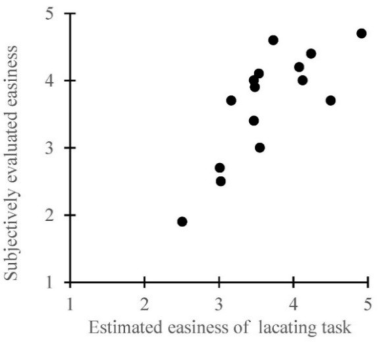
We conducted a multiple regression predicting the effectiveness of a landmark, the easiness of a locating task using a landmark, with the recognizability of the landmark and the distance from user’s current place to the landmark. The multiple regression model with the two independent variables is Eq. (4) with parameters of [Equation or mathematical symbol available in the original paper PDF] = 0.756, [Equation or mathematical symbol available in the original paper PDF] = 0.023, and [Equation or mathematical symbol available in the original paper PDF] = 1.454, where the adjusted R2 = 0.539, F(2, 12) = 9.199, p < 0.01. The results indicate that the goodness of fit of the model is high enough for estimating the easiness elderly users feel.
Figure 3 shows the relationships between the effectiveness of a landmark estimated by the valuation model (Eq. (4)), and the average of evaluated easiness of the locating task acquired in the experiments. The correlation coefficient between the two is 0.778, where the value indicates the correlation is very strong.
Figure 3. The effectiveness of a landmark estimated by the model Eq. (4) and the average of evaluated easiness of the locating task acquired in the experiments.
Modeling of a Valuation Function of Total Effectiveness of Landmarks This section shows a modeling process of the proposed valuation function of total effectiveness of landmarks, Eq. (3), for elderly users.
The experimental data about landmarks the participants used indicates that they only used the nearest or the first and second nearest landmarks to estimate their current position, and not one(s) much far away even though they could see them. This is equivalent with the way confirmed in the former empirical study with younger participants.
We assume that the proposed valuation function for total effectiveness of landmarks, Eq. (3), is applicable for elderly users, as well as younger users. However, a modification has made on the bias of the equation. The bias [Equation or mathematical symbol available in the original paper PDF] is set to “1.0” (Eq. (7)), because the value of the total effectiveness should be “1” (difficult) when the three terms about effectiveness are “0.0” (no clue).
'(l)×V (l )+1.0 (7)
3 wl C
Equation reproduced from the original PDF.
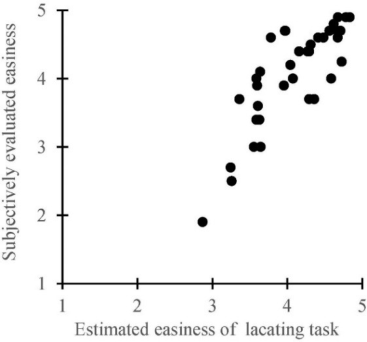
A multiple regression analysis was conducted, where a dependent variable is the total effectiveness of a landmark, i.e., the easiness of a locating task by elderly users, and independent variables are the estimated values of effectiveness of landmarks available at the place (using Eq. (7)). The multiple regression model acquired is Eq. (7) with parameters of w1 =0.746, w2 = 0.025, and w3 = 0.0086, where the adjusted R2 = 0.952, F(3, 34) = 617.28, p < 0.001. The results indicate that the goodness of fit of the model is very high enough for estimating the easiness of the locating task elderly users feel.
Figure 4 shows the relationships between the effectiveness of landmarks estimated by the valuation model (Eq. (7)), and the average of evaluated easiness of the locating task acquired in the experiments. The correlation coefficient between the two is 0.824, where the value indicates the correlation is very strong.
Figure 4. The total effectiveness of landmarks estimated by the modified model Eq. (7) and the average of evaluated easiness of the locating task acquired in the experiments.
A COST FUNCTION FOR ELDERLY PEOPLE This section shows an empirical study conducted in real situation to acquire actual data and modeling process of the proposed cost function for elderly people.
Method
The main tasks of participants were navigation tasks, i.e., following an instructed route from a starting point to a destination by oneself, using a prototype pedestrian navigation system via a smartphone. When they recognized that they made mistakes, they were asked to go back to the point made mistakes and restart the task.
The experiment was conducted at two different areas in Tokyo, i.e., Ueno and Ikebukuro. These areas were chosen to satisfy a condition that the experimental routes include different types of circumstances. The sizes and shapes of buildings and the number of available landmarks are different from each other.
Participants were asked to walk through the assigned route with a digital map displayed on a smartphone (Sharp SO- 04D). The functions implemented to the system were indication of a route from a starting point to destination, automatic periodic updating of the display, and manual selection of the map scale, which are designed to simulate conditions of the navigational guidance practically used. Indication of current position using the GPS was not implemented in this experiment, assuming a situation the position estimation is useless and the user should locate the current position by oneself.
Landmarks depicted on the digital map were only what were selected for the proposed route planning method: convenience stores, restaurants, bank buildings, gasoline stations, school buildings, and public buildings.
Procedures Ten paid participants (five male and five female) took part. Their ages are from 68 to 75 (the average: 71.4).
Two routes were designed in this experiment. The first route in Ueno area had twenty-six intersections, where fourteen of them were guided to turn. The second route in Ikebukuro area had twenty intersections with twelve to turn. The experiment was done in daytime.
The data acquired in the experiment were: the elapsed time to walk between each intersection (time for waiting for the light to change was deleted from the measured data), landmarks used by the participant at the locating task (oral Human Aspects of Transportation I (2021) replies), and the conditions they felt easy or difficult to achieve the task (oral replies).
The elapsed time of participant’s locating task was estimated with the measured time. We assumed that the elapsed time to walk from the intersection (n-1) to the intersection (n) with the locating task is sum of the elapsed time of user’s locating task at the intersection (n) and the elapsed time to walk from the intersection (n-1) to the intersection (n) without the task, where (n) and (n-1) are numbers of intersections in a route. One’s elapsed time to walk without the locating task was calculated using his/her average walking speed.
Modeling This section shows a modeling process of the proposed cost function which considers elapsed time of the locating task for elderly users.
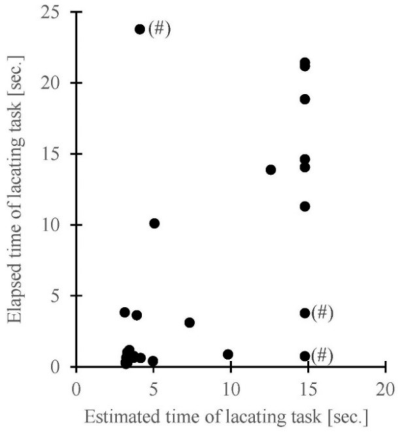
Figure 5 shows the relationships between the elapsed time for user’s locating task estimated by the model (Eq. (6)), and the actual time measured in the experiments. The parameter [Equation or mathematical symbol available in the original paper PDF] was set to 14.78 [sec.] by a regression analysis. The correlation coefficient between the two variables is 0.594, where the value indicated the correlation is moderate.
Figure 5. The time for user's locating task estimated by the model with Eq. (6) and the actual time as the result of the experiment.
An analysis on the data about the landmarks the participant used shows that some participants selected noticeable forms of roads as cues for the locating task instead of the landmarks depicted on the digital map. There were three cases in the experiment, which a symbol of sharp (#) is beside the data in Figure 5. An example of the cue was unusual shape of intersections which are not normal crossroads or T-junction.
The correlation coefficient of the two variables in data without the three cases is 0.892. The value indicated the correlation is very strong. The results suggest that the model acquired in this study is useful for estimating time of user’s locating task for elderly people unless forms of roads are salient.
The results also show that form of roads can be one of the useful cues for the task. It suggests that this cue should be introduced into the functions for developing a practical method of the navigation guidance.
DISCUSSION
Comparison of Easiness of Discovery Tasks with Younger People
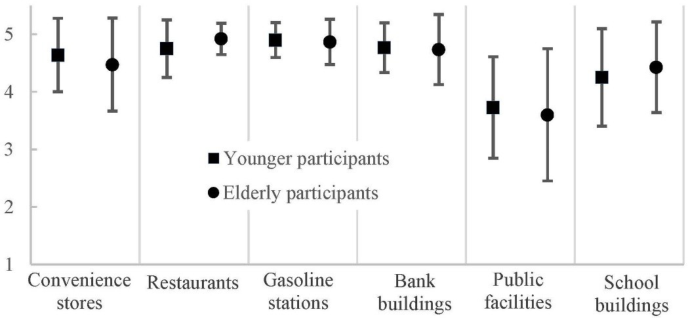
Figure 6 shows the easiness of the discovery task evaluated by younger and elderly participants, which are the averages and standard deviations for the six landmarks. The data for the elderly people are from the first experiment in this study, and for the younger people was acquired through the previous experiment under similar conditions (Furukawa and Uto, 2012). The total number of the participants was twenty six. Welch’s t-test, which does not assume that the variances of the two groups are equal, shows that the easiness evaluated by elderly people is significantly higher than that by younger people only at the condition “Restaurants” (t(40)=1.971, p<0.05).It is not clear the reason why the recognizability of restaurants is significantly different between younger and elderly users at the condition. However, these results may suggest that degradation of elderly people's cognitive capability has only a slight influence on the recognizability against expectation.
Figure 6. The subjective evaluation on easiness of the landmark discovery task by elderly and younger participants.
Comparison of Easiness of Locating Tasks with Younger People
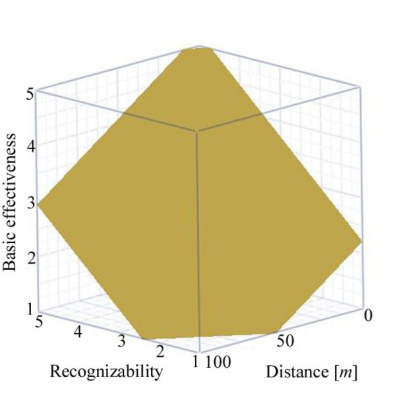
Figure 7 (a) shows the valuation function of effectiveness of a landmark for elderly people, that is Eq. (4) with parameters determined in this study. Figure 7 (b) is the function for younger people (Furukawa and Nakamura, 2012). We can see that the easiness is higher for elderly people than younger people when the conditions, the recognizability of a landmark and distance to the landmark, are same.
(a) Experiment with elderly people (b) Experiment with younger people
Figure 7. The valuation functions of basic effectiveness of a landmark (Eq. (4)) through experiments with elderly and younger participants.
The value of the coefficient [Equation or mathematical symbol available in the original paper PDF] of the cost function Eq. (6), i.e., the maximum time of user’s locating task, is 23.0 [sec.] for younger people (Furukawa and Nakamura, 2013) and 14.78 [sec.] for elderly people. This is consistent with the fact about the easiness of the locating task using a landmark, describe in the previous paragraph.
These two results indicate that the elderly participants felt much easier and took much shorter time to locate their positions in this study than younger participants in the previous experiment. This is against our expectation. A factor might be the difference in the maps they used for the locating tasks. The elderly participants used maps that only the six types of landmarks were depicted, that is to say, there were no other buildings and facilities on the maps. The maps in the previous experiments was original as a map maker provided (Furukawa and Nakamura, 2012&2013). The younger participants might have to select one or some landmarks as cues for the task among the several options depicted on the maps. On the other hand, the elderly users had less options, and might not have to do the selecting task. If this is correct, it can be concluded that maps with the selected landmarks are a useful tool for navigation task, and have ability to cover up the influence of degradation of elderly people's cognitive capability however harmful.
CONCLUSIONS
In order to reduce anxiety of pedestrian navigation users, we have proposed a route planning algorithm, which weighs user’s difficulty (or easiness) of locating own current position as well as total physical distance of courses. The cost function for evaluating routes is expanded by adding elapsed time of locating each intersection to the original cost of route distance. The elapsed time at an intersection is estimated based on valuation functions of effectiveness of landmarks around the intersection. The functions were constructed based on data collected through several cognitive experiments. The fundamental validity of the proposal method was confirmed through experiments, where younger people attended as participants.
The aim of this study was to extend the object of the navigation guidance method to elderly people, as well as younger people. Considering the degradation of cognitive functions, we modified the three models for elderly users: the valuation functions for recognizability of landmarks, the valuation function of landmark’s effectiveness, and the cost function for route planning. Three cognitive experiments were conducted to acquire actual data for the modification. The results indicate that the functions are quite fit to the data acquired in the experiments, and suggest that the method acquired in this study is useful for estimating walking time for routes by elderly users.
Future tasks of this study are following: (1) The first task is the introduction of forms of roads into the valuation functions as cues for locating tasks, as well as the six landmarks. The necessity was confirmed through the third experiment with navigation tests for modeling the cost function.
(2) The second task is the application of the proposed method to disaster evaluation for guiding people to evacuation sites. The aim of the empirical study is confirmation of the fundamental usefulness and the modification of the method if necessary.
ACKNOWLEDGMENT
I am grateful for the assistance given by Mr. Yuki Aoyagi. This work has been partially supported by Grants-Aid for Science Research 23500109 of the Japanese Ministry of Education, Science, Sports and Culture.
REFERENCES
Akasaka, Y., & Onisawa, T. (2008). Personalized pedestrian navigation system with subjective preference based route selection.
In D. Ruan, F. Hardeman, K. Meer (Eds.), Intelligent Decision and Policy Making Support Systems (pp. 73-91). Springer. Caduff, D., & Timpf, S. (2008). On the assessment of landmark salience for human navigation. Cognitive Processing, 9, 249-267. Dijkstra E. W. (1959). A note on two problems in connexion with graphs. Numerische Mathe-matik, 1, 269-271. EZ Navi Walk (n.d.). Retrieved March 1, 2014, from http://eznavi.auone.jp/ (in Japanese) Furukawa, H., & Nakamura, Y. (2012). Pedestrian navigation system based on quantitative estimation of landmark’s effectiveness. In G. Salvendy, W. Karwowski (Eds.), Proceedings of the 4th International Conference on Applied Human Factors and Ergonomics (pp. 391-400), USA Publishing. Furukawa, H., & Nakamura, Y. (2013). A pedestrian navigation method for user’s safe and easy wayfinding. In M. Kurosu (Ed.),
Human-Computer Interaction. Users and Contexts of Use (the 15th International Conference on Human-Computer Interaction) (pp. 156-165), Springer Berlin Heidelberg. Furukawa, H., & Uto. H. (2012). A quantitative evaluation method of landmark effectiveness for pedestrian navigation. In D. Al- Dabass, A. Orsoni, R. Cant (Eds.), UKSim 14th International Conference on Computer Modelling and Simulation (pp. 265- 270), IEEE Computer Society. Miura, H., Takechima, S., Matsuda, N., & Taki, H. (2011). A study on navigation system for pedestrian based on street
illumination. In A. König, et al. (Eds.), Knowledge-Based and Intelligent Information and Engineering Systems (15th International Conference, KES 2011) (pp. 49-55). Springer Berlin Heidelberg. Nakazawa, K., Kita, N., Takagi, K., Inoue, T., Shigeno, H., & Okada, K. (2008). A dynamic map based on landmark’s visibility.
Transactions of Information Processing Society of Japan, 49, 233-241. (in Japanese) NAVITIME (n.d.). Retrieved March 1, 2014, from http://products.navitime.co.jp/service/navitime/ (in Japanese) Park, D. (2000). The basic mechanisms accounting for age-related decline in cognitive functions. Cognitive Aging, 30, 1026-
1036. Tatenami, T., Matsushita, D., & Munemoto, J. (2006). Transition of level of anxiety in wayfinding with pedestrian navigation system on mobile telephone. Journal of Architecture and Planning, 608, 59-64. (in Japanese)
LISTED IN THE AHFE DIGITAL BOOKSTORE CATALOGUE
Explore the complete digital volume
Advances in Human Aspects of Transportation: Part I
Read this individual research paper free through the original publisher, or explore the full digital proceedings book.
ISBN 978-1-4951-2097-8
Explore this ISBN in the AHFE Bookstore ↗Listed in the July 2026 bookstore catalogue; search by ISBN to confirm current availability · Digital book purchase optional