Caroline Ariën, Kris Brijs, Wesley Ceulemans, Giovanni Vanroelen (2021). A Driving Simulator Study on the Effect of Transversal Rumble Strips Located Nearby Dangerous Curves Under Repeated Exposure. In: Advances in Human Aspects of Transportation: Part II. AHFE Open Access, vol. 16. https://doi.org/10.54941/ahfe100701
This study examined drivers’ behavior nearby dangerous curves when they are repeatedly exposed to the same transversal rumble strips which were located on the tangent before the curve. During a period of five successive days, sixteen participants completed a 17km test-drive in a driving simulator with four dangerous curves (two without and two with transversal rumble strips) in a within-subjects design. The selection of these curves was based on the official Belgian accident database and both curves were replicated in the driving simulator as detailed and realistic as possible. Results indicated that the transversal rumble strips induced a speed reduction of 2.3 to 5.9 kph on the tangent before the curve. This speed reduction effect sustained over the experimental period of five days. Taking the speed reduction effect into account, we can conclude that transversal rumble strips have a potential positive traffic safety effect because the reduced speed on the tangent provides more time to the drivers to make a good evaluation of the curve characteristics and environment and adapt their driving behavior in an appropriate way. Notwithstanding, we advise policy makers to make a good selection of potential dangerous curves to avoid excessive implementation of transversal rumble strips.
Accident analyses show that curves are typically prone accident locations on the road network: accident rates are 1.5 to 4 times higher than on tangents (i.e. straight road sections) and 25 to 30% of all fatal accidents occur in curves. In addition, 60 to 70% of all fatal curve-related crashes are single-vehicle run-of-road accidents, whereas head-on collisions occur in 11% of the fatal accidents (Safetynet, 2009a; Torbic et al., 2004).
According to Charlton (2007), inappropriate speed monitoring, failure to maintain a proper lateral position and inability to meet increased attentional demands are the three main behavioral causative factors for accidents in curves. These factors are also related to an inadequate evaluation of the degree of hazard associated with a given curve (Staplin, Lococo, Byington, & Harkey, 2001).
Experimental research on road design and human factors showed that geometric curve properties often relate to these behavioral problems (Brenac, 1996; Khan, Bill, Chitturi, & Noyce, 2014; Safetynet, 2009a). Low curve radii (<200m), inappropriate superelevation, too narrow road lanes and too long curve lengths are most frequently mentioned curve design elements which have adverse effects on traffic safety (Bonneson, Pratt, Miles, & Carlson, 2007; Khan et al., 2014; Safetynet, 2009a). In addition, a long preceding tangent length and a deviant sharp curve design of a single curve within a succession of gently designed curves are related to the extent to which the individual curve geometry fits within the surrounding road environment and showed to increase accident risks (R. Elvik, Hoye, Vaa, & Sorensen, 2009; Findley, Hummer, Rasdorf, Zegeer, & Fowler, 2012; Safetynet, 2009a).
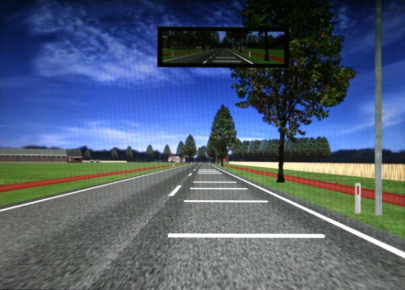
Several studies proposed a wide variety of pavement markings (i.e., directional arrows, centerline or shoulder rumble strips and (peripheral) transversal strips) and signs (i.e., (dynamic) warning signs, advisory speed signs, (chevron) alignment signs and delineators) in order to induce appropriate speed and lateral control in curves (Charlton, 2004, 2007; Comte & Jamson, 2000; Federal Highway Administration, 2009; Hallmark, Smadi, & Hawkins, 2014; Katz, 2004; McGee & Hanscom, 2006). Since this study focuses on pavement markings, and more specifically on transversal rumble strips, we briefly elaborate on the main working mechanism behind this perceptual countermeasure. Transversal rumble strips (TRS) consists of a sequence of transverse colored lines with a raised profile at decreasing distance apart in the travel direction (see figure 1c). They manipulate the visual driving scene and the raised profile generates auditory and tactile feedback. These sensory inputs are meant to create an illusionary impression of increased motion which should result in a decrease in driving speed. Besides assisting drivers in more optimally speed monitoring, TRS have an important alerting function (Godley, 1999; Merat & Jamson, 2013).
Although a wide variety of patterns, colors and spacings are implemented, several field and driving simulator studies have demonstrated the potential speed reduction effect of transversal (rumble) strips in combination with intersections (Godley, 1999; Jamson & Lai, 2011; Montella et al., 2011), rural-urban transitions (Jamson, Lai, & Jamson, 2010), work zones (Bryden, Corkran, Hubbs, Chandra, & Jeannotte, 2013; Meyer, 2004) and curves (Ariën et al., 2012; Comte & Jamson, 2000; Gates, Qin, & Noyce, 2008; Godley, 1999). Elliot, McColl and Kennedy (2003; in Charlton & Baas, 2006) reported localised speed reductions between no effect up to 9,6 kph for transverse groupings of rumble strips. Godley (1999) established speed reductions between 8 and 11 kph near intersections and curves equipped with transverse lines. These results are in line with the speed reduction effects near intersections reported by Montella et al. (2011) (i.e., between 3 and 15 kph). Nevertheless, Rossi et al. (2013) found only moderate speed reductions for optical transversal speed bars near roundabouts (i.e., up to 2 kph). According to Elvik, Høye, Vaa and Sørensen (2009), rumble strips have a positive effect on road safety near junctions: injury accidents are reduced by 33% and the number of property-damage-only accidents decreased with 25%. Although these auspicious results, there is some doubt about the durability (both in time and distance) of the speed reduction effects (Comte & Jamson, 2000; Gates et al., 2008). The literature review of Martens et al. (1997) described that some experiments found that effects remained stable after a year (Zaidel, Hakkert, & Barkan, 1986), while others report that the effects lessen after some weeks or days (Maroney & Dewar, 1987).
Related to these inconclusive effects under repeated exposure (i.e., effect over time), Ariën et al. (2014) performed a literature review concerning the potential influence of novelty effects related to traffic calming measures on driving performance data in driving simulator research as described by Jamson and Lai (2010). Besides the various advantages related to driving simulator research (e.g., total control over various driving conditions, safe, cost efficient, collection of a variety of continuous high rate driving performance data), simulator validation, participant Human Aspects of Transportation II (2021) self-selection, simulator sickness and novelty effects should be taken into account (Jamson et al., 2010; Nilsson, 1993; Rudin-Brown, Williamson, & Lenné, 2009). These novelty effects can be related to the simulator system itself, but can also apply for the specific treatment being tested (for instance traffic calming measures or perceptual countermeasures). Ariën et al. (2014) subdivided driving simulator experiments during which subjects were repeatedly exposed to an identical treatment into two groups: (1) participants were exposed several times to the same treatment during one single simulator session (e.g., Brown, 2001; Jamson et al., 2010; Lewis-Evans & Charlton, 2006; Rossi, Gastaldi, Biondi, & Mulatti, 2013a, 2013b) and (2) participants were exposed several times to the same treatment during multiple simulator sessions spread over different days (e.g., Åkerstedt et al., 2010; Charlton & Starkey, 2011; Domeyer, Cassavaugh, & Backs, 2013; Jenssen, Bjoerkli, Sakshaug, & Moen, 2007; Lenné, Triggs, & Redman, 1997; Manser & Creaser, 2011; Martens & Fox, 2007).
However, the literature available is rather scarce when it comes to examining the impact of technological and/or infrastructural treatments under conditions of repeated exposure on driving behavior. The studies of Jamson and Lai (2010) and Rossi et al. (2013a, 2013b) are the only references we are knowledgeable of which test the impact of infrastructural perceptual countermeasures under repeated exposure specifically. In both studies subjects participated during one single simulator session during which each participant passed four (Jamson et al., 2010) and ten times (Rossi et al., 2013a, 2013b) the same infrastructural measurements. Rossi et al. (2013a, 2013b) averaged the driving performance parameters over the ten trials and did not analyze the effect of the repeated exposure. Jamson and Lai (2010), on the other hand, observed three types of behavioral effects within their range of tested treatments: initial behavior shows a stronger / weaker than future behavior and future behavior can be predicted by initial behavior. Based on this literature review, the main objectives and more specific research questions are formulated.
OBJECTIVES AND RESEARCH QUESTIONS This study will investigate the impact of transversal rumble strips (TRS) located on the tangent before two dangerous curves on the driving behavior of a sample of participants who will be repeatedly exposed to this specific perceptual countermeasure. The main research questions are formulated as follows:
1. Do TRS nearby dangerous curves influence mean speed? 2. How far does the influence of TRS nearby dangerous curves reach? 3. Does the effect of TRS nearby dangerous curves change when the same subjects are repeatedly exposed?
METHODOLOGY
Participants Participants were recruited via e-mail at Hasselt University. Twelve of the twenty-nine volunteers were excluded: three participants suffered from simulator sickness, six participants could not complete the total experimental period of five successive days due to technical problems and two participants were identified as outlier. A participant was defined as an outlier when he/she drove faster or slower than three inter-quartile distances from the group’s mean during 25% of the analysis section. Thus, the remaining sample consists of 18 participants (8 men; mean age: 27.7; SD age: 11.5). All participants had (corrected to) normal vision and gave informed consent. Gender and age were not taken into account as between-subject factors in the statistical analysis.
Apparatus The experiment was conducted on a medium-fidelity driving simulator (STISIM M400; Systems Technology Incorporated). It is a fixed-based (drivers do not get kinesthetic feedback) driving simulator with a force-feedback steering wheel, brake pedal, and accelerator. The simulation includes vehicle dynamics, visual and auditory feedback and a performance measurement system. The visual virtual environment was presented on a large 180° Human Aspects of Transportation II (2021) field of view seamless curved screen, with rear view and side-view mirror images and depiction of the speedometer. Three projectors offer a resolution of 1024 x 768 pixels and a 60 Hz refresh rate. The sounds of traffic in the environment and of the participant’s car were presented. Data were collected at a 60 Hz frame rate.
(a )
Location A Location B
(b)
(c)
Figure 1: (a) Scenario overview; (b) satellite image and real world versus simulator images nearby curves at location A (left) and
B (right); (c) simulator images of TRS at location A (left) and B (right)
Simulation scenario During the 17 km driving scenario four curves, alternated with filler pieces (see figure 1a), were presented to the participants. The curves were programmed according to geo-specific database modelling method. Yan et al. (2008) defined this method as “replicating a real-world driving environment in a simulated virtual world” and is to be differentiated from the fictive driving scenarios. The real-world curves which were replicated in this driving simulator scenario were picked from the existing Flemish road network by means of extensive selection procedure using for instance the official Belgian accident database (Federal Government Statistics Belgium, n.d.), cross- sectional streets views and detailed accident maneuver diagrams. The detailed selection procedure is described in Ariën et al. (2012) and resulted in two dangerous left-oriented compound curves (i.e., combination of different curve radii in one curve) which were both preceded by a long tangent. Table 1 shows more detailed information on the curve characteristics.
Table 1: Curve properties of Location A and B
The road sections which were used for the statistical analyses consisted of a tangent (1200 m) followed by the compound curve and ended again with a tangent (300 to 375 m). The filler pieces, which connected these curve sections, were meant to provide some variation in the driving scenario and consisted of road segments with a variety of speed limits (e.g., 30, 50, 70 and 90 kph), surrounding environment (e.g., rural or urban) and daily changing interactions with other road users. The last 700 m before the first analysis point (i.e., 500 m before the curve entry) was standardized in order to prevent interference from these small day-to-day variations. Weather conditions were sunny and dry.
Procedure Participants agreed to take part for a period of five consecutive weekdays. On the first day, participants were asked to fill out their personal data (e.g., gender, date of birth) and to give their informed consent. The general introduction in the driving simulator was followed by a practice session (first scenario of 4 km rural road with some slight curves and second scenario of 7 km with successively a motorway, a 70 kph rural road with a dangerous curve in right direction and an urban area) in order to get acquainted with the simulator. During the subsequent test trip of 17 km participants passed four dangerous curves (i.e., two curves at location A and two curves at location B and at each location once with TRS and once without TRS) in a counterbalanced order. The order of the four curves (location and TRS present or absent) did not change during the whole experiment for a particular participant because we were specifically interested in the driving behavior of participants who were repeatedly exposed to the TRS in the same configuration. The necessary guidance instructions were provided by a GPS voice. Subjects were instructed to apply the traffic laws as they would (or would not) do in reality and to drive as they normally would in their own car.
Data collection and analysis The main purpose of the TRS under investigation is to improve road safety. Because of the positive relationship between driving speed on the one hand and crash risk and severity on the other hand (Safetynet, 2009b), mean speed is analyzed at eight analysis point along the driving scenario (see figure 1a).
A 2 (marking: no TRS, TRS) × 5 (day) × 8 (analysis points) within-subjects analysis of variance (ANOVA) was conducted on mean speed [kph] for each location separately. Based on Kolomgorov-Smirnov tests of normality and Mauchly’s test of sphericity we corrected for deviation from normality (Bonferroni correction) and sphericity (Greenhouse-Geisser epsilon correction). P-value was set at 0.05 to determine statistical significance. F- and partial eta squared values are mentioned.
RESULTS
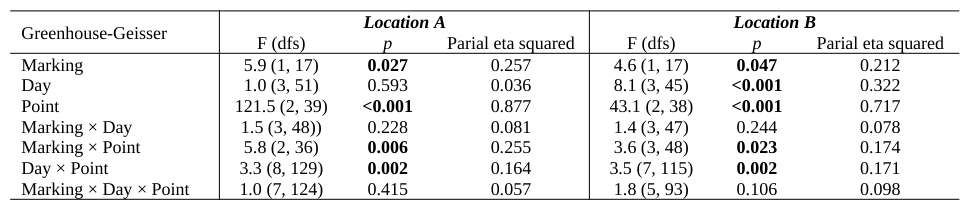
Table 2: ANOVA statistics for location A and B (significant p-values are indicated in bold) Greenhouse-Geisser Location A Location B F (dfs) p Parial eta squared F (dfs) p Parial eta squared Marking 5.9 (1, 17) 0.027 0.257 4.6 (1, 17) 0.047 0.212 Day 1.0 (3, 51) 0.593 0.036 8.1 (3, 45) <0.001 0.322 Point 121.5 (2, 39) <0.001 0.877 43.1 (2, 38) <0.001 0.717 Marking × Day 1.5 (3, 48)) 0.228 0.081 1.4 (3, 47) 0.244 0.078 Marking × Point 5.8 (2, 36) 0.006 0.255 3.6 (3, 48) 0.023 0.174 Day × Point 3.3 (8, 129) 0.002 0.164 3.5 (7, 115) 0.002 0.171 Marking × Day × Point 1.0 (7, 124) 0.415 0.057 1.8 (5, 93) 0.106 0.098
Location A The daily values for mean speed on the 8 analysis points separated for the condition without (left graph) and with (right graph) TRS are shown in figure 2. At 500 m before the curve mean speed was highest and close to the speed limit of 90 kph. During the first four days, participants decelerated to a minimal mean speed near the curve middle. On the fifth day, mean speed was already minimal at the curve entry. Once participants passed the curve middle, they started to accelerate again at a continuous level, but there is some indication that they accelerated more as the days progressed. Overall, mean speed seems to be lower at 166 m and 50 m before the curve entry when TRS were present. In addition, at the curve entry mean speed was very constant during the whole experimental period when TRS was present, compared to the slightly higher mean speeds during the first two days of the experiment and the larger spread over the different days when TRS was absent.
(a) (b)
Figure 2: Mean speed as a function of Marking × Day × Point: (a) TRS absent and (b) TRS present at location A
Figure available in the original PDF paper.
(TRS were located between 150 en 66 m before the curve entry)
Equation reproduced from the original PDF.
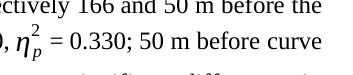
The ANOVA for location A showed a significant main effect of Marking and Point. In addition, there was a significant interaction effect of Marking × Point and Day × Point. Since the combination of the factors Marking and Day were not significant in a two- or three-way interaction, we can conclude from the significant interaction of Marking × Point that mean speed varied across the different analysis points in function of the presence or absence of TRS, but not in function of the day. This means that the effects generated by the TRS on a certain day did not significantly differ from the other four days. Figure 3a shows the mean speed values on the 8 analysis points, separated for the condition with or without TRS but irrespective of the day. Post-hoc analysis for the interaction effect of Marking × Point showed that mean speed was 4.7 to 5.9 kph lower at respectively 166 and 50 m before the curve entry when TRS was present (166 m before curve entry: F(1, 17) = 8.4, p = 0.010, ηp entry: F(1, 17) = 12.6, p = 0.002, ηp 2 = 0.426). At the other six analysis points, there were no significant differences in mean speed between the condition with or without TRS.
Mean speed values on the 8 analysis point, separated for the 5 days but irrespective of the presence or absence of TRS are shown in figure 3b. Post-hoc analysis for the interaction effect of Day × Point showed that some mean speed values significantly varied across the different analysis points on the different days. Interestingly, during the first four days minimal mean speeds were reached at the curve middle, while on the last day participants reached a minimal speed already at the curve entry and continued this speed until the curve middle. It is however important to note that there was no significant difference in mean speed between the curve entry and middle at day 4. Although figure 2 and 3b gave some indication that mean speed increased at the curve end and at 50 and 100 m after the curve end as the days progressed, this was not confirmed by the pairewise comparisons.
Location A
Mean speed [kph]
curve end
curve entry
curve middle
50m after c...
50m before...
100m after ...
500m befor...
166m befor...
(a) (b)
Figure 3: Mean speed for the interaction of (a) Marking × Point and (b) Day × Point at location A (TRS were located between 150 en 66 m before the curve entry)
Figure available in the original PDF paper.
Location B
Figure 4 shows the daily mean speed values for location B on the 8 analysis points, separated for the condition (a) without and (b) with TRS. Starting from a mean speed slightly about the speed limit of 70 kph at 500 m before the curve, participants decelerated to a minimal speed at the curve middle during the five experimental days when TRS was absent. When TRS was present, the same deceleration behavior was present during the first three days, but at day 4 and 5 participants reached their minimal speed already at the curve entry. In addition, both in the condition with and without TRS there seem to be an indication that mean speed increased as the days passed by. Overall, mean speed seems to be lower at 166 m and 50 m before the curve entry when TRS were present. At the curve entry, there seems to be some indication that mean speed was lower during the first two days when TRS was present.
100m after curve
100m after curve
(a) (b)
Figure 4: Mean speed as a function of Marking × Day × Point: (a) TRS absent and (b) TRS present at location B
Figure available in the original PDF paper.
(TRS were located between 150 en 66 m before the curve entry)
The ANOVA for location B showed comparable significant main and interaction effects as at location A, but the main effect of Days was also significant at location B. Since the interaction between Marking and Day or between the three factors was not significant, the interaction effect of Marking × Point indicated that mean speed might have varied across the different analysis points in function of the presence or absence of TRS, but this interaction was irrespective of the day. This means that the effects generated by the TRS on a certain day did not significantly differ from the other four days.
Mean speed values at the 8 analysis points separated for the condition with and without TRS, but irrespective of the day are shown in figure 5a. Post-hoc analysis for the interaction effect of Marking × Point showed that mean speed was 2.6 to 2.3 kph lower at respectively 166 and 50 m before the curve entry when TRS was present (166 m before curve entry: F(1, 17) = 12.0, p = 0.003, ηp 2 = 0.173).
2 = 0.414; 50 m before curve entry: F(1, 17) = 8.2, p = 0.011, ηp 2 = 0.325). In addition, TRS generated a marginally significant speed reduction of 1.0 kph at the curve entry (F(1, 17) = 3.5, p = 0.077, ηp
Mean speed [kph]
curve end
curve entry
curve middle
50m after c...
50m before ...
100m after c...
500m before...
166m before...
(a) (b)
Figure 5: Mean speed for the interaction of (a) Marking × Point and (b) Day × Point at location B (TRS were located between 150 en 66 m before the curve entry) Human Aspects of Transportation II (2021)
Figure available in the original PDF paper.
Figure 5b shows the mean speed values at the 8 analysis points, separated for the 5 days but irrespective of the presence or absence of TRS. Although there were significant speed differences between the curve entry and middle during the total experimental period, mean speeds were slightly (but not significant) lower at the curve middle during the first three days. On the two last days, minimal speed was reached at the curve entry. Comparing the mean speed values at each analysis point between the different days shows that mean speed was significant lower at the first two days compared to the last day from the curve entry until the curve end. In addition, mean speed was also significant lower from the curve end until 100 m after the curve at the first day compared to day 4 and 5. Finally, mean speed at day 3 was significant lower than at day 5 at 50 m after the curve.
DISCUSSION
In this driving simulator study we analyzed mean speed to find out (1) whether TRS located on the tangent before dangerous curves influences mean speed; (2) how far the influence reaches and (3) whether the effect would change when the same participant is repeatedly exposed during a period of 5 successive days. In addition, we try to relate the established results with the geometric curve characteristics of the two dangerous curves under investigation.
Besides some main effects, the ANOVA showed a significant interaction effect of Marking × Point and Day × Point for both location A and B. The absence of a significant interaction between the factors Marking and Day or between the three factors Marking, Day and Point reveal that the potential influence of TRS on mean speed is independent of the day. This means that the effects generated by TRS on a certain day were not significant different from the other four days.
During the five successive days of the experiment period and at both curve locations (A and B), TRS generated a significant speed reduction on the tangent in the direct vicinity of the TRS, more specifically at 166 and 50 m before the curve (TRS was located between 150 and 66 m before the curve). At location A, significant speed reductions between 4.7 and 5.9 kph were measured. The size of the speed reduction effect of the TRS at location B was smaller (i.e., 2.3 to 2.6 kph), but there was also a marginally significant speed reduction effect at the curve entry of 1.0 kph. These speed reductions are in line with the results of for instance (Elliot et al., 2003; Montella et al., 2011; Rossi et al., 2013b). According to the Elvik’s power model for rural roads (Rune Elvik, 2009, p. 58), speed reductions of that size might induce a decrease in fatal accidents and injury accidents on the tangent at location A up to 35% and 12% respectively and up to 16% and 6% at location B.
Several studies established that drivers start to explore curves between 100 m and 30 m before the curve entry (Milleville-Pennel, Jean-Michel, & Elise, 2007; Tsimhoni & Green, 1999). The lower driving speed on a tangent equipped with TRS gives drivers thus more time to satisfy the increased need for visual information on curved roads, to make an adequate evaluation of the degree of risk and to meet increased attentional demands associated with the curve. In addition, due to their lower speed on the tangent, drivers are less forced to suddenly adapt their driving behavior just before they enter the curve or along the curve itself, compared to a situation in which their approaching speed was higher. This is an important issue because accidents occur primarily at both the curve entry or the curve end (PIARC, 2003).
The results of the interaction effect of Day × Point showed that a minimal mean speed was reached at the curve middle at the first three days and at the curve entry at the last two days. These results are somewhat in line with Mintsis (1988) who observed lowest speed in the middle of the curve and Taragin (1954) who suggested that drivers adjust their speed before entering a curve and continue at a contact speed throughout the curve. Another element related to this interaction effect is the (indication of an) increase in mean speed beginning at the curve entry as the days pass by. This evolution over the days might be related to Wilde’s theory of risk homeostasis (Milleville-Pennel et al., 2007) or the driving behavior model of Weller and colleagues (Weller, Schlag, Friedel, & Rammin, 2008) in which drivers adjust their driving behavior as a result of an appraisal of the perceived risks with an acceptable risk threshold. During the first days, participants seem to ‘overestimate’ the perceived risk of the curves and lower their speed. However, the successive exposure during the following days might adjust their risk perception and participants feel confident to increase their mean speed which does not benefit road safety.
When we compare driving behavior in the curve at location A and B and determine the V85 speed differential Human Aspects of Transportation II (2021) between the tangent (166 m before the curve) and the curve entry, we see that V85 reduced with 12 kph at location A and 5 kph at location B. According to Lamm et al. (1999) the curve at location B has a good design quality, whereas the design quality of the curve at location A is acceptable. In addition, Anderson et al. (in PIARC, 2003) established that the accident rate at a curve section with a speed differential of 10 kph to 20 kph is twice as high as a curve with a speed differential of less than 10 kph. The established differences in driving behavior at location A and B can be attributed to the differences in their geometric design characteristics and the different curve radii and curve lengths of the individual curve segments of the compound curves (see table 1). Odhams and Cole (2004) found for instance a positive relationship between speed choice and both lane width and curve radius. The lower speed limit of 70 kph, the absence of bicycle facilities and the smaller lane width at location B might be the main reasons why mean speed at location B was lower than at location A.
LIMITATIONS AND FUTURE RESEARCH The reporting of results of driving simulator studies often goes together with discussions about external validity. Although moving base simulators generated a greater degree of realism (Bella, 2009), several studies showed indications that fixed-base driving simulators can examine geometric design issues in a perfectly adequate way (e.g., Bella, 2007, 2008; Benedetto, Calvi, & Messina, 2012; Calvi, Benedetto, & De Blasiis, 2012; Charlton, 2004; Federal Highway Administration, 2007). In addition, the 180° seamless curved screen used in this study satisfies the prescribed minimum field of view of 120° in order to make correct estimation of longitudinal speed (Kemeny & Panerai, 2003).
Future research on TRS can focus on additional driving parameters related to longitudinal and lateral speed (e.g. acceleration/deceleration or lateral position) or on different geometric design configurations to improve road safety nearby dangerous curves. Although we tried to anticipate the potential influence of novelty effects of TRS on mean speed by this quite unique experimental setup (besides the studies of Ariën et al., 2014; Jamson & Lai, 2011; Rossi et al., 2013a, 2013b) where participants were repeatedly exposed during 5 successive days, we are unable to pronounce upon the long term effect of these TRS as in a before-after field experiment. Future research can thus focus on longer term naturalistic driving studies and a before-after field experiment.
CONCLUSION AND POLICY RECOMMENDATIONS The paper has investigated the effect of transversal rumble strips (TRS) located near dangerous curves on mean speed of a sample of participants who were repeatedly exposed to this specific perceptual countermeasure. The driving simulator study has established that TRS generated a significant reduction of mean speed (i.e., between 2.3 kph and 5.9 kph) on the tangent proceeding to the curve and that these effects on mean speed are irrespective of the day. The speed reduction effect sustained thus over the five-day experiment period. Although the speed reduction effect did not proceed until the curve entry and further along the curve, the lower speed on the tangent gives drivers more time to make an adequate evaluation of the degree of risk with the curve and to adapt their driving behavior in an appropriate way. Besides this potential positive effect on mean speed, TRS work also as an alerting device (Merat & Jamson, 2013). Despite these favorable effects, some studies warn for the produced noise when a vehicle passes by the TRS (Dewar & Olson, 2007; Martens et al., 1997). Based on these results, we can conclude that TRS is a low-cost perceptual countermeasure that has the potential to improve road safety near dangerous curves. Notwithstanding, we advise policy makers to make a good selection of potential dangerous curves to avoid excessive implementation of transversal rumble strips.
REFERENCES
Åkerstedt, T., Ingre, M., Kecklund, G., Anund, A., Sandberg, D., Wahde, M., … Kronberg, P. (2010). Reaction of sleepiness indicators to partial sleep deprivation, time of day and time on task in a driving simulator – the DROWSI project. Journal of Sleep Research, 19(2), 298–309. doi:10.1111/j.1365-2869.2009.00796.x Ariën, C., Brijs, K., Brijs, T., Ceulemans, W., Vanroelen, G., Jongen, E. M. M., … Wets, G. (2014). Does the effect of traffic
calming measures endure over time? – A simulator study on the influence of gates. Transportation Research Part F: Traffic Psychology and Behaviour, 22, 63–75. doi:10.1016/j.trf.2013.10.010 Ariën, C., Brijs, K., Ceulemans, W., Jongen, E. M. M., Daniels, S., Brijs, T., & Wets, G. (2012). The effect of pavement markings on driving behavior in curves: A driving simulator study. Presented at the Transportation Research Board, Washington, D.C.: Transportation Research Board. Bella, F. (2007). Parameters for Evaluation of Speed Differential: Contribution Using Driving Simulator. Transportation
Research Record: Journal of the Transportation Research Board, 2023, 37–43. doi:10.3141/2023-05 Bella, F. (2008). Driving simulator for speed research on two-lane rural roads. Accident Analysis and Prevention, 40, 1078–1087. Bella, F. (2009). Can the driving simulators contribute to solving the critical issues in geometric design? Transportation Research Board Annual Meeting 2009. Retrieved from http://pubsindex.trb.org/view.aspx?id=880535 Benedetto, A., Calvi, A., & Messina, M. (2012). Potentialities of driving simulator for engineering applications to Formula 1.
Advances in Transportation Sciences, 127–138. doi:10.4399/978885484657912 Bonneson, J., Pratt, M., Miles, J., & Carlson, P. (2007). Horizontal curve signing handbook (No. FHWA/TX-07/0-5439-P1) (p.
56). Texas: Texas Transportation Institute. Brenac, T. (1996). Safety at Curves and Road Geometry Standards in Some European Countries. Transportation Research Record: Journal of the Transportation Research Board, 1523(-1), 99–106. doi:10.3141/1523-12 Brown, C. M. (2001). New in-vehicle technologies: are lane departure warnings a good thing? (Vol. 2, pp. 70–74). Presented at
the SELF-ACE 2001 Conference - Ergonomics for changing work. Bryden, J. E., Corkran, M. O., Hubbs, C. W., Chandra, A. K., & Jeannotte, K. L. (2013). Traffic enforcement strategies for work zones (p. 44). Washington, D.C.: Transportation Research Board - National Cooperative Highway Research Program. Calvi, A., Benedetto, A., & De Blasiis, M. R. (2012). A driving simulator study of driver performance on deceleration lanes.
Accident Analysis & Prevention, 45, 195–203. doi:10.1016/j.aap.2011.06.010 Charlton, S. G. (2004). Perceptual and attentional effects on drivers’ speed selection at curves. Accident Analysis & Prevention, 36(5), 877–884. doi:10.1016/j.aap.2003.09.003 Charlton, S. G. (2007). The role of attention in horizontal curves: A comparison of advance warning, delineation, and road
marking treatments. Accident Analysis & Prevention, 39(5), 873–885. doi:10.1016/j.aap.2006.12.007 Charlton, S. G., & Baas, P. H. (2006). Speed change management for New Zealand roads (Research report No. 300). New Zealand: Land Transport New Zealand. Charlton, S. G., & Starkey, N. J. (2011). Driving without awareness: The effects of practice and automaticity on attention and
driving. Transportation Research Part F: Traffic Psychology and Behaviour, 14(6), 456–471. doi:10.1016/j.trf.2011.04.010 Comte, S. L., & Jamson, A. H. (2000). Traditional and innovative speed-reducing measures for curves: an investigation of driver behaviour using a driving simulator. Safety Science, 36(3), 137–150. doi:10.1016/S0925-7535(00)00037-0 Dewar, R., & Olson, P. (2007). Human factors in traffic safety. Tucson: Lawyers & Judges Publishing Company, Inc. Domeyer, J. E., Cassavaugh, N. D., & Backs, R. W. (2013). The use of adaptation to reduce simulator sickness in driving
assessment and research. Accident Analysis & Prevention, 53, 127–132. doi:10.1016/j.aap.2012.12.039 Elliot, M. A., McColl, V. A., & Kennedy, J. V. (2003). Road design measures to reduce drivers’ speed via “psychological” processes: a literature review. (No. TRL564). Crowthorne, Berkshire, UK: Transport Research Laboratory. Elvik, R. (2009). The Power Model of the relationship between speed and road safety - Update and new analyses (No.
1034/2009). Oslo: Institute of Transport Economics. Elvik, R., Hoye, A., Vaa, T., & Sorensen, M. (2009). The handbook of road safety measures (second.). UK: Emerald. Federal Government Statistics Belgium. (n.d.). Official Belgian accident databank (1997-2007). Federal Highway Administration. (2007). Drivers’ evaluation of the diverging diamond interchange (TechBrief No. FHWA- HRT-07-048). FHWA Federal Highway Administration. Federal Highway Administration. (2009). Manual on uniform traffic control devices for streets and highways. FHWA Federal
Highway Administration. Findley, D. J., Hummer, J. E., Rasdorf, W., Zegeer, C. V., & Fowler, T. J. (2012). Modeling the impact of spatial relationships on horizontal curve safety. Accident Analysis & Prevention, 45(0), 296–304. doi:10.1016/j.aap.2011.07.018 Gates, T., Qin, X., & Noyce, D. (2008). Effectiveness of Experimental Transverse-Bar Pavement Marking as Speed-Reduction
Treatment on Freeway Curves. Transportation Research Record, 2056(1), 95–103. Godley, S. T. (1999). A driving simulator investigation of perceptual countermeasures to speeding. Monash University. Hallmark, S. L., Smadi, O., & Hawkins, N. (2014). Speed reduction impacts of dynamic speed feedback signs on rural two lane curves. Presented at the Transportation Research Board 93rd Annual Meeting, Washington, D.C. Jamson, S., & Lai, F. (2011). Are novelty effects of road safety treatments observable in simulator experiments? Presented at the
TRB 2011 Annual Meeting, Washington DC: Transportation Research Board. Jamson, S., Lai, F., & Jamson, H. (2010). Driving simulators for robust comparisons: A case study evaluating road safety engineering treatments. Accident Analysis & Prevention, 42(3), 961–971. doi:10.1016/j.aap.2009.04.014 Jenssen, G. D., Bjoerkli, C. A., Sakshaug, K., & Moen, T. (2007). Behavioural adaptation to adaptive front lighting systems
(AFS): a six day driving simulator study. Presented at the 14th World Conference on Intelligent Transport Systems, Beijing. Retrieved from http://trid.trb.org/view.aspx?id=916173 Katz, B. J. (2004). Pavement markings for speed reduction. Science Applications International Corporation - Turner-Fairbank Highway Research Center. Kemeny, A., & Panerai, F. (2003). Evaluating perception in driving simulation experiments. Trends in Cognitive Sciences, 7(1),
31–37. doi:10.1016/S1364-6613(02)00011-6 Khan, G., Bill, A. R., Chitturi, M., & Noyce, D. A. (2014). Safety evaluation of horizontal curves on rural undivided roads.
Presented at the 92nd Annual Meeting of the Transportation Research Board, Washington DC. Lamm, R., Mailaender, T., & Psarianos, B. (1999). Highway design and traffic safety engineering handbook. McGraw-Hill. Lenné, M. G., Triggs, T. J., & Redman, J. R. (1997). Time of day variations in driving performance. Accident Analysis & Prevention, 29(4), 431–437. doi:10.1016/S0001-4575(97)00022-5 Lewis-Evans, B., & Charlton, S. G. (2006). Explicit and implicit processes in behavioural adaptation to road width. Accident
Analysis & Prevention, 38(3), 610–617. doi:10.1016/j.aap.2005.12.005 Manser, M., & Creaser, J. (2011). Assessing driver behavioral adaptation to rural intersection driver support system. Presented at the 6th International Driving Symposium on Human Factors in Driver Assessment, Training and Vehicle Design, Lake Tahoe, California. Maroney, S., & Dewar, R. (1987). Alternatives to enforcement in modifying the speeding behavior of drivers. Transportation
Research Record, 1111, 121–126. Martens, M. H., Comte, S., & Kaptein, N. A. (1997). The effect of road design on speed behavior: A literature review (Deliverable D1 No. RO-96-SC.202). Finland: VTT Communities & Infrastructure. Martens, M. H., & Fox, M. R. J. (2007). Do familiarity and expectations change perception? Drivers’ glances and response to
changes. Transportation Research Part F: Traffic Psychology and Behaviour, 10(6), 476–492. doi:10.1016/j.trf.2007.05.003 McGee, H. W., & Hanscom, F. R. (2006). Low-cost treatments for horizontal curve safety (No. FHWA-SA-07-002). Washington DC: Federal Highway Administration. Merat, N., & Jamson, A. H. (2013). The effect of three low-cost engineering treatments on driver fatigue: A driving simulator
study. Accident Analysis & Prevention, 50(0), 8–15. doi:10.1016/j.aap.2012.09.017 Meyer, E. (2004). Evaluation of data from test application of optical speed bars to highway work zones (Final report No.
KTRAN: KU-00-4). Kansas: University of Kansas. Milleville-Pennel, I., Jean-Michel, H., & Elise, J. (2007). The use of hazard road signs to improve the perception of severe bends.
Accident Analysis & Prevention, 39(4), 721–730. Mintsis, G. (1988). Speed distribution on road curves. Traffic Engeneering and Control, 29, 21–27. Montella, A., Aria, M., D’Ambrosio, A., Galante, F., Mauriello, F., & Pernetti, M. (2011). Simulator evaluation of drivers’ speed, deceleration and lateral position at rural intersections in relation to different perceptual cues. Accident Analysis & Prevention, 43(6), 2072–2084. doi:16/j.aap.2011.05.030 Nilsson, L. (1993). Behavioural research in an advanced driving simulator - Experiences of the VTI system. Proceedings of the
Human Factors and Ergonomics Society 37th Annual Meeting, 37(1), 612–616. Odhams, A. M., & Cole, D. J. (2004). Models of driver speed choice in curves. Cambridge University Engineering Department. PIARC. (2003). Road safety manual - Recommendations from the World Road Association (PIARC). Route 2 Market. Rossi, R., Gastaldi, M., Biondi, F., & Mulatti, C. (2013a). Effects on lateral position of perceptual measures in affecting driver’s perceived speed. Presented at the 4th Internation Conference on Road Safety and Simulation, Rome, Italy. Rossi, R., Gastaldi, M., Biondi, F., & Mulatti, C. (2013b). Oppel-kundt illusion and lateral optic flow manipulation in affecting
perceived speed in approaching roundabouts: experiments with a driving simulator. Presented at the 92nd Transportation Research Board Meeting, Washington DC. Rudin-Brown, C. M., Williamson, A., & Lenné, M. G. (2009). Can driving simulation be used to predict changes in real-world crash risk? (No. 299). Monash University Accident Research Centre. Safetynet. (2009a). Roads. Safetynet. (2009b). Speeding. Staplin, L., Lococo, K., Byington, S., & Harkey, D. (2001). Guidelines and recommendations to accomodate older drivers and
pedestrians (Final report No. FHWA-RD-01-051) (p. 92). Federal Highway Administration. Taragin, A. (1954). Driver performance on horizontal curves. Proc. Ann. Meeting, 33, 446–466. Torbic, D. J., Harwood, D. W., Gilmore, D. K., Pfefer, R., Neuman, T. R., Slack, K. L., & Hardy, K. . (2004). Guidance for implementation of the AASHTO strategic highway safety plan. Volume 7: A guide for reducing collisions on horizontal curves (No. 500, volume 7). Washington DC: Transportation Research Board - National Cooperative Highway Research Program. Tsimhoni, O., & Green, P. (1999). Visual demand of driving curves determined by visual occlusion. Presented at the Vision in
Vehicles VIII Conference, Boston. Vanduyver, A., & Depestele, R. (2002). Verkeerssignalisatie (second.). Brugge: Uitgeverij Vanden Broele. Weller, G., Schlag, B., Friedel, T., & Rammin, C. (2008). Behaviourally relevant road categorisation: A step towards selfexplaining rural roads. Accident Analysis & Prevention, 40(4), 1581–1588. doi:10.1016/j.aap.2008.04.009 Human Aspects of Transportation II (2021)
Yan, X., Abdel-Aty, M., Radwan, E., Wang, X., & Chilakapati, P. (2008). Validating a driving simulator using surrogate safety measures. Accident Analysis and Prevention, 40, 274–288. Zaidel, D., Hakkert, A. S., & Barkan, R. (1986). Rumble strips and paint stripes at a rural intersection. Transportation Research
Record, 1069, 7–12.
LISTED IN THE AHFE DIGITAL BOOKSTORE CATALOGUE
Explore the complete digital volume
Advances in Human Aspects of Transportation: Part II
Read this individual research paper free through the original publisher, or explore the full digital proceedings book.
ISBN 978-1-4951-2098-5
Explore this ISBN in the AHFE Bookstore ↗Listed in the July 2026 bookstore catalogue; search by ISBN to confirm current availability · Digital book purchase optional