George M Sammonds, Mike J Fray, Neil J Mansfield (2018). Overall Car Seat Discomfort Onset during Long Duration Driving Trials. In: Advances in Physical Ergonomics and Human Factors: Part II. AHFE Open Access, vol. 2. https://doi.org/10.54941/ahfe100051
Mansfield et al. (2014) proposed a multi-factorial conceptual model for overall car seat discomfort that includes static, dynamic and temporal factors and suggests that overall car seat discomfort increases with time. Driving duration has been reported to significantly influence driver discomfort and long term evaluations of driver discomfort are necessary when assessing the performance of a car seat. This paper reports a laboratory study where 10 subjects (6 male and 4 female) conducted 140 minutes driving on a dynamic driving simulator and reported their discomfort every 10 minutes. It is observed that discomfort increases with time; however the rate of discomfort onset is shown to decrease with extended duration of driving (>70 minutes), and therefore it is observed that discomfort does not increase linearly across the 140 minute trial. It is concluded that drivers may alter their behaviour to cope with increased levels of discomfort as driving duration increases and suggests that future work should aim to investigate the theory that participants move in the seat with increasing frequency as overall car seat discomfort increases. Furthermore, future work should aim to validate the conceptual model proposed by Mansfield et al. (2014) against greatly extended driving duration and should aim to incorporate the change in rate of discomfort onset observed in this study when predicting long term driver discomfort.
In the automotive industry today, driver comfort has developed from being considered a luxury to a requirement and consumers now demand comfort (Kolich and Tabourn, 2004). A comfortable seat now plays an important, though not exclusive role in the perception of a vehicle’s overall quality (Kyung et al., 2008). As a result of consumers’ increased need and expectation of vehicle comfort, manufacturers have been pursuing more effective methods to improve car seat comfort and improvements in comfort are seen as an effective method to gain an advantage over competitors in the market (Kyung et al., 2008).
Many cars are purchased on the basis of comfort in the showroom (Mansfield, 2005); however this can be misleading as sitting in one posture for a prolonged duration will result in increased discomfort. Manufacturers should consider both short term and long term comfort when improving seating design and research into the field of driver discomfort has demonstrated that a ‘showroom’ analysis or static analysis is not sufficient as it fails to encompass many of the factors affecting overall car seat discomfort. Porter et al. (2003) demonstrated that short term evaluations of comfort are inadequate as the effects of fatigue and long term sitting have not been accounted for and Mansfield et al. (2014) showed that it is insufficient to ignore the effects of long term exposure to vibration.
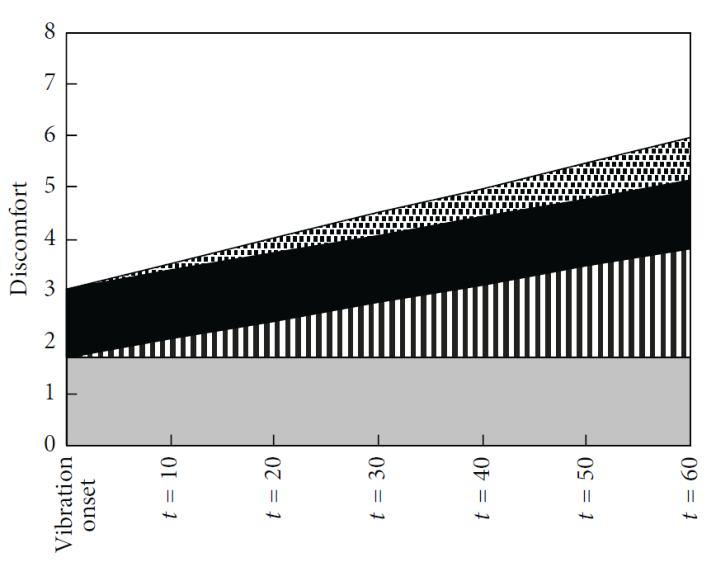
Mansfield’s model of overall car seat discomfort describes vehicle seating as having 3 main factors: static factors, dynamic factors and temporal factors. Static factors are described as factors that focus on seat stiffness, factors which do not change in response to the dynamic environment of the vehicle, whereas dynamic factors are associated with the whole-body vibration experienced from the vehicle. Temporal factors are attributed to the effects of time and long term sitting and manufacturers need to consider all of these factors when designing for driver comfort. In addition there is an interaction effect whereby vibration increases the rate of fatigue (Figure 1).
Figure 1: Mansfield’s model of overall car seat discomfort (Mansfield et al., 2014).
In order to completely understand a vehicle’s comfort it is crucial to test for an extended duration and previous research has suggested that driving trials have a duration of at least 2 hours to accurately determine the performance of a seat (Gyi and Porter, 1999). Porter et al. (2003) demonstrated that although some seats are considered uncomfortable after about 15 minutes, others that are initially considered comfortable become uncomfortable after about an hour and therefore long term driving trials will obtain more useful information than short term evaluations.
Previous research into commercial vehicle driver comfort has implemented trial durations ranging from 60 seconds to 135 minutes (Kolich, 2003a; Gyi and Porter, 1999), and findings demonstrate that temporal factors greatly influence driver discomfort as significant changes in overall car seat discomfort have been observed at approximately 80 - 110 minutes of driving (Gyi and Porter, 1998). This study intends to investigate a longer duration than previous research mentioned and also aims encompass another important factor affecting driver discomfort as described by Mansfield et al.’s (2014) model; vibration.
AIMS AND OBJECTIVES The aim of this study is to evaluate the influence of temporal factors and dynamic factors across long term driving and determine the rate of discomfort onset with greatly extended driving duration. This study aims to validate the knowledge proposed in previous literature in the field of driver discomfort and determine the success of models proposed with extended duration driving.
Therefore the objectives of this study are:
To determine the effect of extended exposure times on local and overall car seat discomfort.
To compare the rate of onset of discomfort between the first and last hours of the trial.
To evaluate the success of the quantitative model proposed in the literature against exposure times longer than previously tested.
METHODOLOGY
Sample and Design 10 participants, consisting of 6 males and 4 females, from the local area and student population of Loughborough University were recruited to participate in a laboratory study. Participants were required to be aged between 18 and 65, and held a full driving license to ensure that posture and task required during the study would be familiar. Furthermore, participants were only recruited if they had been driving regularly in the year prior to the study.
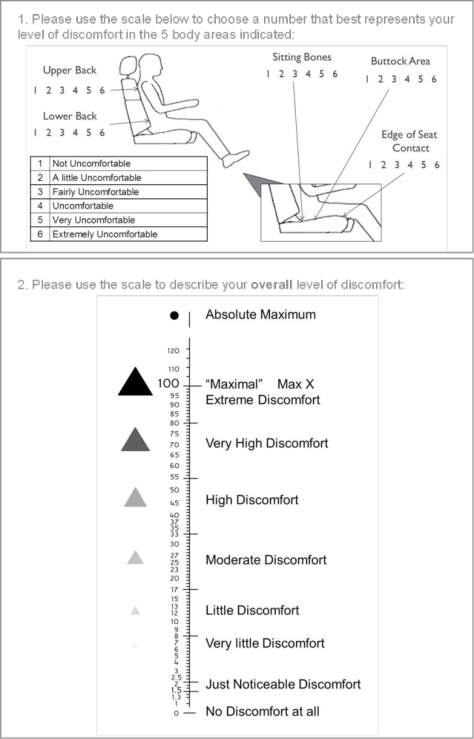
Each trial consisted of 140 minutes continuous driving on the driving simulator housed at Loughborough University and participants were required to provide subjective discomfort ratings verbally every 10 minutes via the use of a 2 part questionnaire. Participants were trained in the use of the questionnaire prior to participation in the study and the questionnaire was positioned in the participants’ field of vision whilst driving. The questionnaire design can be seen in Figure 2, with part one of the questionnaire focusing on local discomfort and part two focusing on overall discomfort. Part one of the questionnaire includes the 6 point discomfort scale proposed by ISO 2631-1 (2003) and part two utilises a newly developed overall discomfort rating scale adapted from the Borg CR100 scale (Borg and Borg, 2002). This rating scale proved to be more successful in pilot studies than other typical discomfort scales as it provides participants with a wider range of responses and allowed for subtle changes in discomfort. Part one of the questionnaire acted as a primer for part two.
Figure 2: Questionnaire design.
Participants were not interrupted from the driving task in order to provide discomfort responses. Previous research has implemented a method of pausing the task in order for participants to provide verbal or written feedback before continuing. Pilot studies conducted prior to the trial suggested that pauses from the driving task would allow participants to move freely in the seat and relieve some of the discomfort that they had been experiencing. As people move when seated, pressure is relieved from compressed body parts with impeded blood flow (Hermann and Bubb, 2007) and pauses from driving allowed for participants to alter posture and therefore reduce discomfort. This study required participants to continue driving whilst providing verbal responses with the aim of accurately determining overall discomfort for a long term drive.
Prior to participation in the study, participants’ age, height and weight were recorded and temperature (ºC) and relative humidity (%RH) of the laboratory were recorded prior to each trial. Participants’ height and weight ranged from 163cm to 184cm and 56.4kg to 93.1kg with an age range of 20 to 34. Temperature and relative humidity remained relatively constant throughout the study with ranges of 24ºC to 28.1ºC and 41.1% to 47.6%. This was important as car seat foam performance may alter with dramatic changes in atmospheric conditions.
Equipment Vibration exposure was simulated using the Rexroth Hydraudyne B.V Micro Motion 600-6DOF-200-MK5 multi- axis vibration simulator (MAViS) located at Loughborough University. Subjects were exposed to multi axis vibration with an r.s.s. magnitude of 0.25m/s2 r.m.s. The vibration was a replay of a recording of 6-dof motion at the floor of a car driving on a rough city road in Finland, and was adjusted in magnitude to represent a similar experience to a normal drive in the UK.
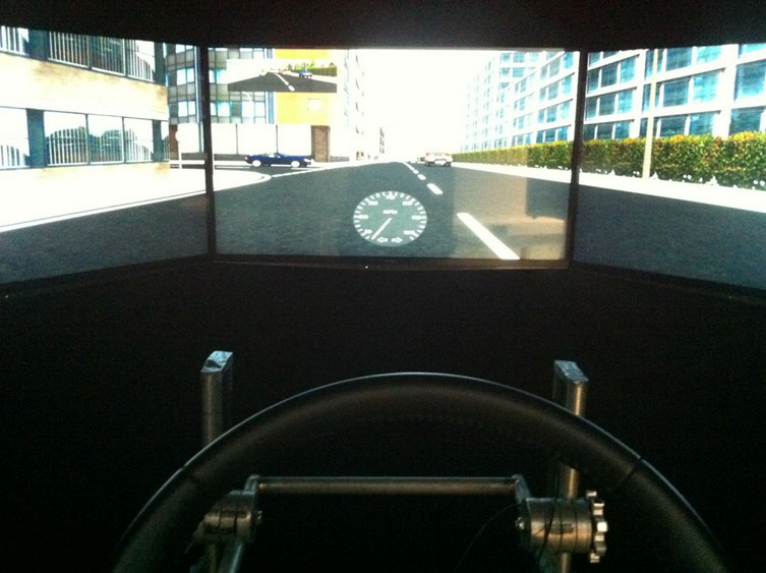
A production car seat frame accompanied by a production seat foam cushion were provided by a commercial manufacturer and a rig was designed that housed the seat in addition to the steering wheel and pedals used to control the driving simulator. This rig replicated dimensions from a current production vehicle and a production steering wheel was used. Participants were directed audibly along a standardised route throughout the drive on the simulator, via the use of GPS navigation style instructions.
Figure 3: View of driving simulator from driver's seat.
RESULTS AND DISCUSSION
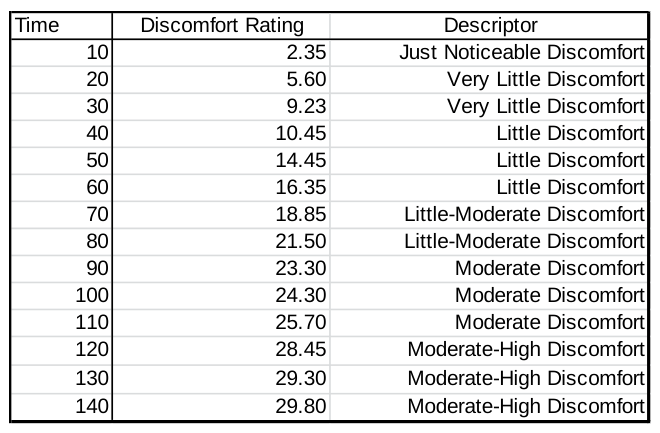
The results show that overall discomfort (part two of the questionnaire) increases with duration of driving, supporting the results found in the literature. When comparing the mean overall discomfort rating recorded at each time interval with the verbal descriptors incorporated into the discomfort scale used, it is possible to describe the discomfort experienced at each time interval. This is shown in Table 1 and it can be observed that, on average, participants reached ‘little discomfort’ after 40 minutes of driving, ‘moderate discomfort’ after 90 minutes of driving and ‘moderate-high discomfort’ after 120 minutes of driving. Participants are yet to record extreme levels of discomfort after 140 minutes of driving and this suggests that participants are yet to reach such high levels of discomfort that they are unable to continue the driving task. The overall discomfort results also suggest that the rate of discomfort onset decreases with duration of driving.
Table 1: Mean overall discomfort ratings described by verbal descriptors.
Local Discomfort The results for local discomfort (part 1 of the questionnaire), displayed in Figure 5, follow a similar trend to the results for overall discomfort and support the findings for part 2 of the questionnaire. Participants were asked to provide a discomfort rating for 5 body parts and this data can be useful when highlighting any body parts with particularly high discomfort.
In this study it is observed that no singular body part dominates the local discomfort responses, as each body part shows a progressive increase in discomfort with time and no particular body part contributes a significant proportion of the overall discomfort at each time interval. The most commonly reported side effect of whole body vibration is lower back pain, as stated by Mansfield (2005), and the results show a similar trend as the largest increase in discomfort is reported in the lower back region. However, discomfort ratings reported for the lower back are only marginally higher than discomfort ratings reported for the buttock area suggesting that lower back pain cannot be attributed as the only cause for overall discomfort increase.
Furthermore, the body part that is reported as having the highest discomfort rating does not change with duration of driving, with each body part representing a similar percentage of the overall discomfort rating at each time interval throughout the trial.
Another benefit of local discomfort analysis is that, due to the fact that participants reported their local discomfort prior to providing an overall discomfort rating, it led participants to consciously reflect on their perceived discomfort and helped participants to accurately determine their responses for part 2 of the questionnaire, improving the quality of the overall discomfort responses.
Most importantly, the cumulative results for local discomfort are shown to follow a similar trend to the overall discomfort ratings shown in Figure 4. Discomfort increases quickly during the first 50 minutes of the trial; however the rate of increase decreases with duration of driving.
Results obtained during this study can be seen below in Figures 4 and 5. Figure 4 shows increases in mean overall discomfort with time and displays a change in gradient over time. Figure 5 shows that when analysing local discomfort, the lower back and buttock area were the most uncomfortable after 140 minutes of driving. Figure 5 also supports the results shown in Figure 4 as a change in gradient over time can also be observed with local discomfort.
35
Equation reproduced from the original PDF.
30
25
20
Equation reproduced from the original PDF.
15
Overall Discomfort Rating
10
5
0
0 10 20 30 40 50 60 70 80 90 100 110 120 130 140
Time (Minutes)
Figure 4: Average Overall Discomfort Rating for all participants.
Figure available in the original PDF paper.
16
Seat Contact
14
Buttock Area Sitting Bones
Lower Back
12
Upper Back
10
8
Discomfort Rating
6
4
2
0
0 10 20 30 40 50 60 70 80 90 100 110 120 130 140
Time (Minutes)
Figure 5: Average Local Discomfort Rating. Physical Ergonomics II (2018)
Figure available in the original PDF paper.
Comparing the Rate of Discomfort Onset over Time As discomfort increases throughout the duration of the trial, the main objective of this study was to analyse the rate of discomfort onset and to determine whether the rate of discomfort onset changes with duration of driving. Much of the literature suggests that overall car seat discomfort increases in a linear fashion; however few studies have observed a duration of over 2 hours.
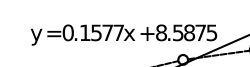
As shown in Figure 4, when comparing the gradients of the mean overall discomfort ratings for the first 70 minutes with the last 70 minutes of the trial, it is clear that there is a change in gradient. The last 70 minutes show a less steep incline in comparison to the first 70 minutes with regression line gradients of 0.27 and 0.16 respectively. This suggests that discomfort does not increase linearly throughout the duration of the trial and that at some time interval the rate of discomfort onset begins to decrease.
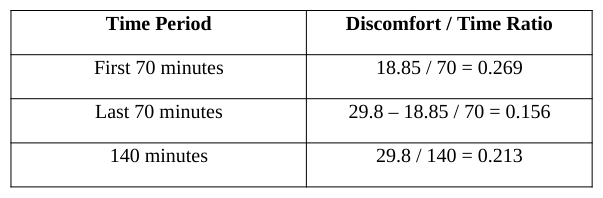
This can easily be observed when we compare the discomfort/time ratio for each half of the trial. This was calculated by dividing the mean overall discomfort score by the time at which it was recorded and a table outlining these ratios can be seen in Table 2.
Table 2: Discomfort over time ratio.
Overall discomfort is shown to increase at a rate of 2.69 on the discomfort scale per 10 minutes of driving for the first 70 minutes of a long term drive; however this rate decreases after 70 minutes of driving to 1.56 per 10 minutes for the next 70 minutes. When we analyse the discomfort/time ratio for each time interval, a steady decline is observed after 80 minutes of driving. This can be seen in Figure 6.
0.35
0.3
0.25
0.2
0.15
Discomfort / Time Ratio
0.1
0.05
0
10 20 30 40 50 60 70 80 90 100 110 120 130 140
Time (Minutes)
Figure 6: Discomfort / time ratio across the whole trial.
Figure available in the original PDF paper.
If overall discomfort increased in a linear fashion, as stated by much of the literature, the discomfort/time ratio would remain constant throughout the duration of the trial. When analysing Figures 4 and 6, and Table 2, it can be seen that discomfort does not increase linearly throughout the whole duration of the trial. The quantitative model proposed by Mansfield et al. (2014) that can be used to predict the onset of discomfort suggests that discomfort increases linearly. When analysing the data obtained in this study it can be observed that this model would be extremely successful until between 60 and 80 minutes. Therefore, the quantitative model would be very useful in predicting discomfort for journeys up to an hour in duration; however this model may need to be adapted to incorporate the changes in discomfort onset observed after 80 minutes.
20
First 70
18
Last 70
16
14
12
10
8
Overall Discomfort Rating
6
4
2
0
0 10 20 30 40 50 60 70
Time (Minutes)
Figure 7: Comparison between first 70 minutes and last 70 minutes relative to scores at t = 0 and t = 70.
Figure available in the original PDF paper.
The graph displayed in Figure 7 shows a comparison between overall discomfort ratings recorded during the first 70 minutes of the trial and the last 70 minutes of the trial. In order to observe a comparison, individual discomfort ratings for the last 70 minutes were transformed so that both sets of data had an origin of zero. This was produced by subtracting the average overall discomfort rating recorded at 70 minutes from the following discomfort ratings recorded at each time interval after 70 minutes (Adjusted Discomfort Rating = Overall Discomfort Rating – 18.85). This data can be seen below in Table 3.
Table 3: Adjusted mean overall discomfort ratings for last 70 minutes.
This allows for a comparison to be made between discomfort ratings the first and second half of the trial and T-tests were performed in order to establish whether a significant difference can be observed (α = 0.05):
- t = 40 vs. t = 110 transformed, one tailed P = 0.056353 - t = 50 vs. t = 120 transformed, one tailed P = 0.042621 - t = 60 vs. t = 130 transformed, one tailed P = 0.006154 - t = 70 vs. t = 140 transformed, one tailed P = 0.03538 A significant difference is observed after 50 minutes and implies that after 120 minutes the overall discomfort ratings recorded follow a significantly different trend to those obtained before 130 minutes. Therefore it can be concluded that the rate of discomfort onset significantly decreases after 120 minutes of driving.
This raises the question as to why this decrease in rate of discomfort onset is observed and why discomfort does not increase linearly with greatly extended journey duration. One theory is that participants are experiencing a ceiling affect, whereby as they reach high levels of discomfort they simply cannot become any more uncomfortable and therefore plateau at an extremely high level of discomfort. As the scale used ranges from 0 – 120, with 0 being no discomfort and 120 being the absolute maximum, it would be expected for participants to reach this ceiling affect towards the upper limit of the scale. The highest mean overall discomfort rating recorded during this study is 29.8 which is described as ‘Moderate-High Discomfort’ as discussed previously. On average, participants are yet to experience even ‘High Discomfort’ and when analysing individual responses, rarely do participants record responses of ‘High Discomfort’ as the maximum value recorded for an individual was 50. Therefore, as the upper limits of the scale have not been reached it can be concluded that this ceiling affect is unlikely to be a product of the participants reaching the upper limit of discomfort. Furthermore, this ceiling affect may be observed due to the design of the scale, as participants may reach the upper limit of the scale and would therefore be unable to provide higher ratings of discomfort. However, as the upper limit of the scale has not been reached it can be concluded that this ceiling affect is not a product of the design of the scale.
Another theory is that participants may be becoming ‘used to their discomfort’ or are coping with the discomfort they are experiencing more affectively. After 80 minutes one participant stated when asked about their perception of discomfort: “I feel like I am getting used to it. I became uncomfortable really quickly but now I don't feel so bad” (Male, 23).
This could possibly be purely psychological and participants really are becoming used to their discomfort, however it is more likely that participants are coping with their discomfort more affectively. Another participant stated after providing a discomfort rating that was lower than the rating given for the previous 10 minutes that: “(My rating) went down because I shifted my weight” (Male, 23)
This suggests that this participant adapted their behaviour to cope with the higher levels of discomfort and could be due to the principle that when a person first sits down they move little, however over extended periods of sitting, increased discomfort has been shown to lead to significant increases in In-Chair Movements (Bendix et al., 1985; Jenson and Bendix, 1992). People move unconsciously when seated, even when driving, with the purpose of relieving pressure on compressed body parts with impeded blood flow (Hermann and Bubb, 2007) and frequent movements have been associated with high discomfort (Bhatnager et al., 1985). Therefore the decrease in rate of discomfort onset could be a product of the participant coping more affectively with their discomfort, by moving more frequently in the seat.
CONCLUSIONS AND RECOMMENDATIONS FOR FUTURE WORK Ultimately, it can be concluded that the rate of discomfort onset decreases over the last 70 minutes of the 140 minute trial and that with greatly extended driving duration, drivers may alter their behaviour to cope with increased levels of discomfort. Future work should aim to investigate the theory that participants move in the seat with increasing frequency as overall car seat discomfort increases, with the purpose of relieving discomfort. As stated previously, participants were required to continue driving whilst providing discomfort responses. This is important as this method did not allow for participants to relieve their discomfort by moving in the seat when pausing from the driving task. This method ensured that participants’ discomfort ratings reflected the duration they had been driving but more importantly, any movements in the seat could be recorded as an unconscious method to relieve discomfort. If a measure of drivers’ movements can be implemented and compared with subjective ratings of discomfort this opens the door for driver discomfort measurements to be made by remote monitoring and could replace the need for subjective assessment, which many argue possesses its own issues.
Furthermore, as discomfort onset is not shown to follow a linear pattern, future work should aim to validate this finding further and investigate the success of the quantitative model proposed by Mansfield et al. (2014) by testing this against greatly extended driving duration. Mansfield et al.’s (2014) model is shown to be extremely successful when predicting discomfort for journeys up to an hour in duration, however in order to predict discomfort for long term driving (>1 hour) the model will need to account for the change is discomfort onset observed during this study.
REFERENCES
Bendix, T., Winkel, J., & Jessen, F. (1985). Comparison of office chairs with fixed forwards or backwards inclining, or tiltable seats. European Journal of Applied Physiology and Occupational Physiology, 54(4), pp. 378-385. Bhatnager, V., Drury, C. G., & Schiro, S. (1985). Posture, postural discomfort, and performance. Human Factors:
The Journal of the Human Factors and Ergonomics Society, 27(2), pp. 189-199. Borg, E., & Borg, G. (2002). “A comparison of AME and CR100 for scaling perceived exertion”, Acta Psychologica, 109 (2), pp. 157-175. Gyi, D. E., & Porter, J. M. (1999). “Interface pressure and the prediction of car seat discomfort”, Applied
Ergonomics, 30 (2), pp. 99-107. Hermann, S., & Bubb, H. (2007). “Development of an objective measure to quantify automotive discomfort over time”. Industrial Electronics, 2007. ISIE 2007. IEEE International Symposium on, 2824-2830. ISO. (1997). Mechanical vibration and shock: Evaluation of human exposure to whole-body vibration. part 1,
general requirements: International standard ISO 2631-1: 1997 (E) ISO. Jensen, C., & Bendix, T. (1992). Spontaneous movements with various seated-workplace adjustments. Clinical Biomechanics, 7(2), pp. 87-90. Kolich, M. (2003). “Automobile seat comfort: Occupant preferences vs. anthropometric accommodation”. Applied
Ergonomics, 34 (2), pp. 177-184. Kolich, M., & Taboun, S. (2004). “Ergonomics modelling and evaluation of automobile seat comfort”. Ergonomics, 47 (8), pp. 841-863. Kyung, G., Maury A. (2008). Driver sitting comfort and discomfort (part II): Relationships with and prediction
from interface pressure. International Journal of Industrial Ergonomics, 38 (5), pp. 526-538. Kyung, G., Maury A. & Babski-Reeves, K. (2008). “Driver sitting comfort and discomfort (part I): Use of subjective ratings in discriminating car seats and correspondence among ratings”. International Journal of Industrial Ergonomics, 38 (5), pp. 516-525. Mansfield, N. J. (2005). Human response to vibration. CRC Press. Mansfield, N. J., Mackrill, J., Rimell, A. N., & MacMull, S. J. (2014) “Combined Effects of Long-Term Sitting and
Whole-Body Vibration on Discomfort Onset for Vehicle Occupants”. ISNR Automotive Engineering, 2014, Article ID 852607, 8 pages. doi:10.1155/2014/852607 Porter, J. M., Gyi, D. E., & Tait, H. A. (2003). “Interface pressure data and the prediction of driver discomfort in road trials”. Applied Ergonomics, 34 (3), pp. 207-214.
LISTED IN THE AHFE DIGITAL BOOKSTORE CATALOGUE
Explore the complete digital volume
Advances in Physical Ergonomics and Human Factors: Part II
Read this individual research paper free through the original publisher, or explore the full digital proceedings book.
ISBN 978-1-4951-2105-0
Explore this ISBN in the AHFE Bookstore ↗Listed in the July 2026 bookstore catalogue; search by ISBN to confirm current availability · Digital book purchase optional