Jordan Smith, Neil Mansfield, Diane Gyi (2021). Seat Design Parameters for an Elevated Driving Posture. In: Advances in Human Aspects of Transportation: Part I. AHFE Open Access, vol. 15. https://doi.org/10.54941/ahfe100637
Studies have shown that whilst emissions from passenger vehicles have fallen in the last 20-years, emissions from light commercial vehicles (LCVs) have risen. An elevated driving seat will result in a driving posture higher than in conventional vehicles and will benefit vehicle deign in terms of a reduction in vehicles’ mass potentially resulting in reduced emissions. This paper reports on a study with the objective of identifying the static seat design parameters for such an elevated seat. A sample of 20 commercial drivers (10 males, 10 females) aged 19-65, were recruited for the study. A driving rig was designed and built to offer nine key seat sub-component adjustments, deemed highly important to selecting a comfortable driving set up. Each sub-component was adjusted in an iterative process to define an optimum position for each driver and was then recorded along with participant verbatim. Results indicated that leg length is a good predictor of the seat height and the distance from the pedals (PH Gap) and that sitting height is a good predictor for the positioning of the backrest. The preferred length of the seat base was much shorter and the width much wider, respectively, than that observed in current LCVs.
It is estimated that 24% of CO2 emissions in the UK is contributed by transport, with road vehicles being the most significant contributor (Department of Energy and Climate Change, 2013). The design of vehicles (e.g. rail vehicles, trams buses, cars, delivery vehicles, vans) for city use requires a balance between the benefits of being light and compact and the benefits of having a large load capacity. By making the vehicle light and compact, the fuel economy and manoeuvrability can increase. With loading considerations, if it is possible to reduce the space required to package a driver in to these types of vehicles, then the vehicle can benefit in two ways: a more compact driver package can result in an increased overall loading space or can result in an overall reduction in the length of the vehicle itself. Both of these end results are environmentally and economically positive. By adjusting the driving posture within a vehicle to being more upright, the space required to package a driver in to the vehicle cabin can be much less. Most current vehicle designs require the driver to sit in a low seat with a semi-recumbent posture with legs extended towards the front of the vehicle. If the height of the seat is increased the driving posture can be altered such that the feet are positioned further back, thus reducing the need for space in front of the driver.
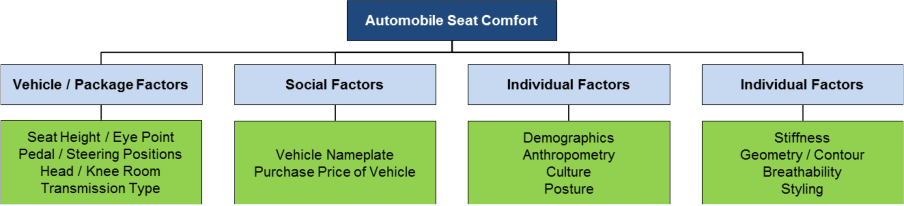
‘Seat comfort’ is something which today has still not been well defined. It has been previously described as the absence of discomfort (Hertzberg, 1972), which takes away the ambiguity of labelling a seat as comfortable and instead gives way to a scale of incremented levels of discomfort. Whilst this ambiguity remains, comfort is considered to be one of the most important aspects of seat design and comfortable seating is no longer considered a luxury; it is a requirement (Kolich and Taboun, 2004). This view is prominent in the automotive industry today, with customer requirements driving further research in to comfortable seating. This is no mean feat, with subjectivity, anthropometry, seat geometry and driving task exposure all carrying weight (Thakurta et al. 1995). Kolich (2008) validated this observation by defining the various factors that affect subjective perceptions of seat comfort (Figure 1), illustrating how important it is to consider more than just the geometry of the seat.
This study was aimed at identifying seat design parameters for an elevated driving posture and so it was concerned with static seat comfort, which refers to the sitting impressions of seat occupants when there is no vibration (Ebe and Griffin, 2001). In order to understand the seat parameters for any posture, user trials provide a beneficial insight into how varying driver sizes interact with a vehicle package. The use of fitting trials is an effective method of allowing drivers to position themselves in their optimum driving position for a given vehicle set up. Porter and Gyi (1998) adapted the fitting trial process from Jones (1969), which utilized iterative adjustments of vehicle cabin parameters. This involved adjusting each parameter incrementally through its travel and back again, until a comfortable range was identified. This iterative process with fine increments of adjustment provided an accurate measurement and the selective control was very advantageous in providing a realistic range of optimum driving positions. The benefits of this process lend themselves to this study, investigating unknown parameters for an untested driving posture.
METHODS
Sampling 20 commercial vehicle drivers, 10 males and 10 females, were recruited from the population of staff at Loughborough University to take part in this study. The inclusion criteria for recruitment were that participants were aged 19-65, had held a full UK driving license for at least 2 years and had driving experience with light commercial vehicle (LCV) driving (e.g. Vans, trucks, minibuses, horse boxes, camper vans etc.). The context of this study was aimed at drivers with LCV experience, in order to provide a point of reference when assessing a comfortable driving position aimed at that vehicle type. The sampling strategy was to include as large an anthropometric spread as feasibly possible and the Loughborough University Ethical Advisory Committee (LUEAC) approved this study.
Rig Design and Build A driving rig was designed to have multiple adjustments of nine seat sub-components that were selected as being highly important factors for seat comfort and was achieved following these steps:
1. Identify which areas of the seat need to be adjustable for the fitting trial.
2. Identify what type of adjustment is required and exactly how much (lateral, vertical, prominence etc.).
3. Logistically plan how each adjustment can be engineered in to one driving rig.
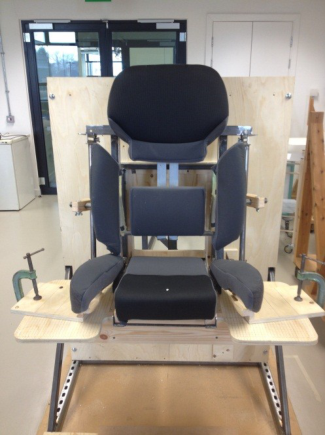
The seat was developed from a current production Nissan NV200 seat, which was selected as a benchmark seat in the LCV market. Once the nine sub-components were identified: Seat Height; Pedal Distance; Seat Base Length; Seat Base Width; Lumbar Height; Lumbar Prominence; Upper Backrest Height; Backrest Lateral Support; Armrest Position, the seat was cut in to sections and re-upholstered accordingly (Figure 2). The driving rig was set up for automatic transmission with just the accelerator (A) and brake (B) pedals and a fully adjustable steering wheel in terms of height, proximity and angle. The dimensions were measured using an anthropometer.
Figure 2. Fitting trial driving rig in proximal and distal set up (left to right).
Experimental Design Prior to the fitting trial, participants were measured to gain a full record of anthropometric data deemed important to self-selecting a comfortable driving posture. The measurements were taken using a stadiometer, sitting height table and an anthropometer to collect the following: Stature; Sitting height; Shoulder width; Sitting hip width; Popliteal length; Popliteal height; Knee height; Leg length; Foot length; Sitting elbow height. Participants were measured without shoes and were asked to wear flat shoes for the fitting trial.
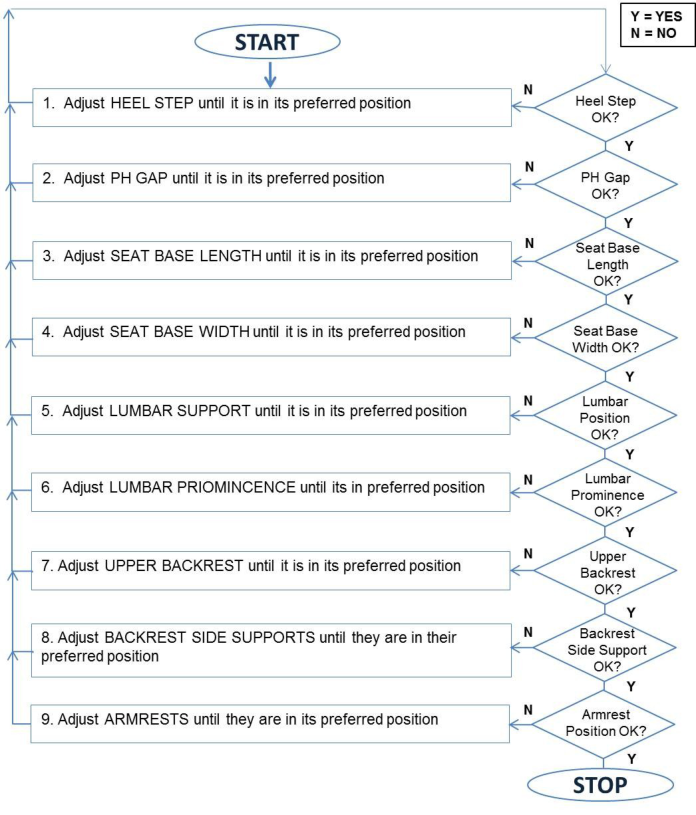
The fitting trial method followed a tried and tested method (Porter and Gyi, 1998), as it is has been proven to be an accurate and systematic way of identifying the optimum location for the seat and driver package components, which contribute to achieving a comfortable driving position. The trial involved an iterative process of adjustment of one seat sub-component at a time, in a predetermined order (Figure 3). Components were adjusted in this order until deemed to be in its optimum position for each participant and if after any adjustments, a previous position was compromised, the process would start again from that position. This continued until each participant had a full optimum seat set up for their elevated driving posture, at which point the position was measured.
Figure 3. Fitting trial iterative process of adjustment.
This fitting trial was intended to test an elevated driving posture and so was designed for heel steps higher than those observed in similar vehicle types. The investigator encouraged participants to sit higher (increased heel step) by setting the seat at an initially high position in comparison to standard vehicles. Once participants were happy with their driving position, they were asked to give feedback on their overall comfort including any areas of the seat which offered more or less support than LCV seats they had previously driven in. These questions were open-ended and aimed at gaining a greater understanding of participants’ final seat set up.
RESULTS AND DISCUSSION
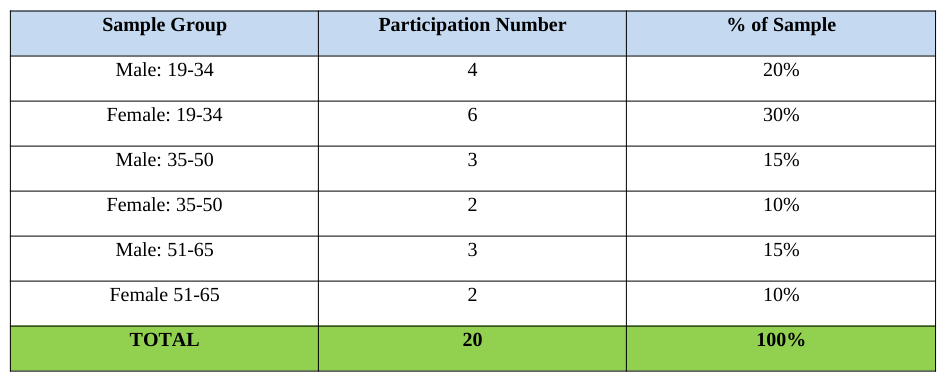
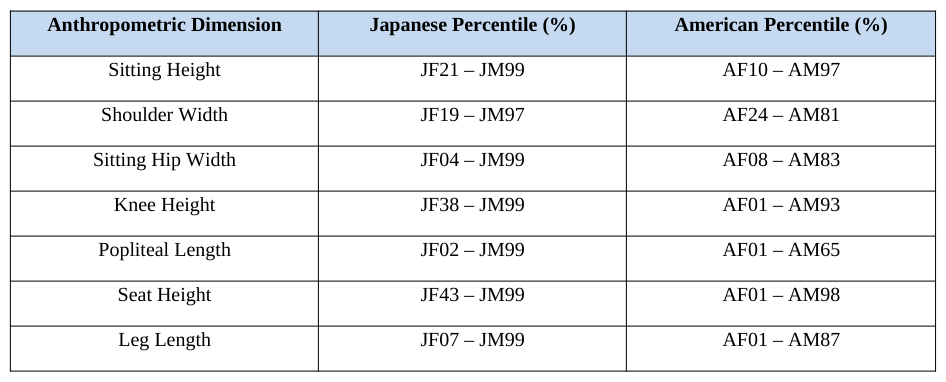
Sample A total of 20 participants with LCV experience (10 males and 10 females) completed the fitting trial, the distribution is summarized in Table 1, showing that the highest proportion of both male and female drivers were aged 19-34. The range of anthropometric percentiles of the sample is detailed in Table 2 and shows that for leg length, the spread was between Japanese Female 7th percentile (JF07) to American Male 87th percentile (AM87).
Table 1: Sample group - age and gender distribution (n=20) Sample Group Participation Number % of SampleTable 2: Sample anthropometric percentile range (n=20)
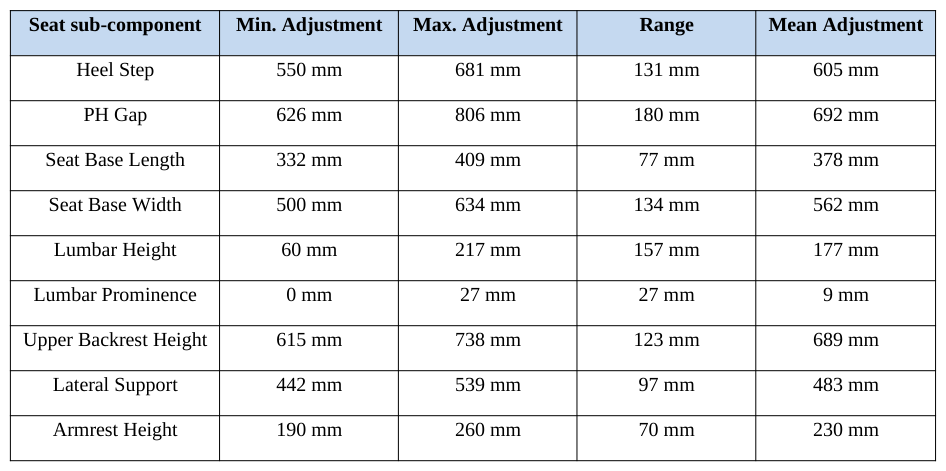
Descriptive Analysis The descriptive analysis showed that for this elevated posture the dimension with the biggest range of adjustment (180mm) was the PH Gap (distance between the pedal set and the driver hip point in X), whilst the lumbar prominence had the smallest range of adjustment (27mm). The selected seat base length was found to have the biggest impact upon the final heel step and PH gap for each participant. The large range for the lumbar height (157mm) reflects the diversity in where participants require this support, along with the importance of this for an elevated driving posture (Table 3).
Table 3: Seat sub-component adjustment ranges and descriptive statistics
Seat Parameters vs. Anthropometry Descriptive statistics were carried out on the data using a ‘Linear regression’ test, which showed that driver leg length was a good predictor of the heel step for participants, which was statistically significant (Linear Regression, p<0.01).This was also true of driver leg length for predicting the PH gap for participants (Linear Regression, p<0.01). Additionally, results showed that driver sitting height was a good predictor of the self-selected upper backrest height, which was statistically significant (Linear Regression, p<0.01). For all other driver anthropometry, there were no statistically significant correlations with the self-selected positions of seat sub-components.
The results indicate that for an elevated driving posture, the seat base length needs to be reduced from the seat dimensions observed in these types of vehicles, especially for smaller drivers where manoeuvrability of the legs for pedal operation is of importance. The compromise for seat base length lies with the larger percentile drivers, who need a longer seat base length to offer adequate support for their thighs whilst seated. The seat design recommendation is for the seat to be 380mm in length, which is approximately 80mm shorter than a benchmark seat for this vehicle type. For the seat base, larger percentile drivers required more width to offer sufficient lateral support when seated. This was contrary to smaller percentile drivers who did not need as much width to receive the same lateral support benefits. The seat design recommendation is for the seat base width to be 550mm (inclusive of seat bolsters), which is wider than a benchmark seat for this vehicle type. For the height of the backrest, results indicated that larger percentile drivers required more support, higher up from the upper backrest, due to the nature of a more upright posture. The seat design recommendations is for the backrest to be 690mm in height, from the seat pad, which is approximately 40mm taller than a benchmark seat for this vehicle type, in order to offer adequate support for the upper back and shoulders.
CONCLUSIONS
The study confirmed that drivers were able to find a comfortable seat set up in an elevated driving posture. The fitting trial process itself was successful in determining a range of positions for seat sub-components, in an iterative and flowing process. The construction of the rig with the many areas of adjustment alongside the fitting trial method ensured that participants could reach their optimum seat set-up, without having to compromise comfort in any one area. Results showed that leg length was a good predictor of both heel step and PH gap, and that sitting height was a good predictor of the self-selected upper backrest position, all of which were significant (Linear Regression, p<0.01). The testing indicated that there are new considerations for seat parameters in an elevated driving posture; specifically, a shorter seat base length.
REFERENCES
Ebe, K., Griffin, M. J. (2001). “Factors Affecting Static Seat Cushion Comfort”, Ergonomics, Volume 44 No. 10. pp. 901-921 Hertzberg, H. T. E. (1972). “The Human Buttocks in Sitting: Pressures, Patterns, and Palliatives”, Technical Paper No. 72005.
Society of Automotive Engineers, Inc. New York, NY, USA. Jones, J. C. (1969). “Methods and Results of Seating Research”, Ergonomics, Volume 12 No. 2. pp. 171-181 Kolich, M. (2008). “A Conceptual Framework Proposed to Formalize the Scientific Investigation of Automobile Seat Comfort”, Applied Ergonomics, Volume 39. pp. 15-27 Kolich, M., Taboun, S. M. (2004). “Ergonomics Modelling and Evaluation of Automobile Seat Comfort”, Ergonomics, Volume
47 No. 8. pp. 841-863 Porter, J. M., Gyi, D. E. (1998). “Exploring the Optimum Posture for Driver Comfort”, International Journal of Vehicle Design, Volume 19 No. 3. pp. 255-266 Thakurta, K., Koester, D., Bush, N., Bachle, S. (1995). “Evaluating Short and Long Term Comfort”, Technical Paper No.
950144. Society of Automotive Engineers, Inc. Warrendale, PA, USA. Department of Energy and Climate Change. (2012), 2012 UK Greenhouse Gas Emissions, Provisional Figures and 2011 UK Greenhouse Gas Emissions, Final Figures by Fuel Type and End-user. Department of Energy and Climate Change Website: https://www.gov.uk/government/uploads/system/uploads/attachment_data/file/ 193414/280313_ghg_national_statistics_release_2012_provisional.pdf
LISTED IN THE AHFE DIGITAL BOOKSTORE CATALOGUE
Explore the complete digital volume
Advances in Human Aspects of Transportation: Part I
Read this individual research paper free through the original publisher, or explore the full digital proceedings book.
ISBN 978-1-4951-2097-8
Explore this ISBN in the AHFE Bookstore ↗Listed in the July 2026 bookstore catalogue; search by ISBN to confirm current availability · Digital book purchase optional