Weimin Zhai, Chien-Hsiung Chen (2022). Graphic Icon and Information Presentation Types of Hover Feedback Designs on the User Interface of Shopping Websites. In: Usability and User Experience. AHFE Open Access, vol. 39, pp. 297–302. https://doi.org/10.54941/ahfe1001720
The usability of the user interface for shopping websites is a very important design issue pertinent to the user experience. Graphic icons, as a visual presentation aid, provide an excellent interactive experience to the users while interacting with the user interface. The purpose of this study was to explore the usability of graphic icons and information presentation types in the operation of shopping websites, and propose design suggestions for future improvements. A 2 x 2 mixed factorial design was planned to help explore whether the graphic icons (i.e., presence or absence) and different information presentation types (i.e. plain text information and information visualization) may affect users’ task performance and questionnaire of the System Usability Scale (SUS). The experiment adopted the convenience sampling method. A total of 20 participants were recruited to take part in the experiment. The experimental data were collected regarding the participant’s task performance and questionnaire of the System Usability Scale (SUS), as well as semi-structured interviews. The generated results revealed that: (1) Graphic icons significantly affect users’ task performance. The presence of graphic icons improves users’ task performance more than the absence of graphic icons in plain text information. However, the result is opposite in the condition of information visualization. (2) The analysis of SUS showed a significant interaction effect between the graphic icons and the information presentation types. (3) The presence of graphic icons can significantly provide more efficiency than the absence of graphic icons in plain text information. Nonetheless, the result is opposite in the condition of information visualization. It is hoped that the results generated from this study can be a good design reference for future Website designers.Keywords: Shopping website; Mouse hover; Icon symbol; Information visualization; SUS
In online shopping, product information is one of the most critical factors influencing users’ loyalty to shopping sites. In fact, rich and accurate product information has most significant impact on users’ online shopping experie- nce (Yin & Xu, 2021). However, shopping sites are often overloaded with a large amount of product information, which may facilitate users’ shop- ping behavior, but still may create a certain degree of information overload
(Groissberger & Riedl, 2017). As a visual sign, a graphic icon can convey information and facilitate memorization. In digital user interface designs, icons can optimize the layout of the interface and enhance the user’s pleasure when interacting with them (Niu et al., 2019). Research has shown that gra- phic icons can help users make inferences about information more effectively than plain text (Ware, 2010). However, studies have shown that graphic icons can also cause misunderstanding and sometimes lead to a poor user experi- ence (Batista, do Valle Filho, Mafioletti, & Novakoski, 2019). Therefore, it is imperative to study the impact of icon design on users during the web- site interface design process. Data is often displayed as graphical elements in information visualization that greatly facilitate human cognitive processing. However, sometimes the visualized graphics presented may be misinterpreted by the user, leading to poor decision-making (Lavalle et al., 2021). Plass et al. (2009) argue that from the point of view of visual complexity, any visual ele- ment added to a visual display will lead the user to require more cognitive resources to process the information. By so doing, we explore whether the graphic icons (i.e., presence or absence) and different information presenta- tion types (i.e., Plain text information and information visualization) may affect users’ task performance.
METHOD
Participants We invited 20 participants (i.e., 12 males and 8 females) in the range of 18 to 30 years old to experience different shopping websites via convenience sam- pling method. The education level is above the bachelor’s degree. Basically, they have experience in using shopping websites.
Materials and Apparatus The software of Photoshop was employed for the graphic design in this study. The experimental prototypes were completed with Mockingbot. The Lenovo Ideapad Y700 notebook, with a monitor of 15.6 inches (37 cm) at a resolution of 1920 ×1080, was used as the experimental platform.
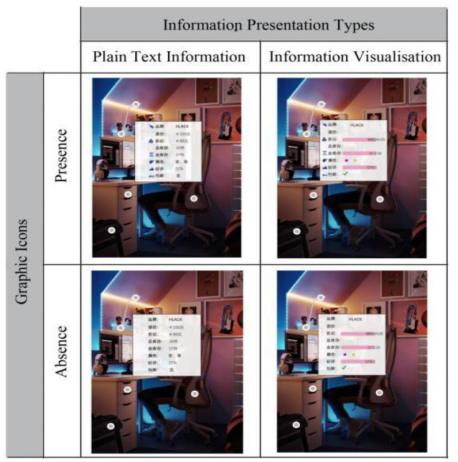
Experimental Design and Procedure The experiment was conducted with a 2 (the graphic icons) × 2 (informa- tion presentation types) two-factor mixed design. The graphic icons were the within-subjects factor, and the two levels were presence or absence. The information presentation types were the between-subjects factor, and the two levels were plain text information and information visualization. The pro- totypes of this experiment are shown in Fig. 1. Regarding the color study of the graphic icons, the color combination of the icons in blue on a white background has good legibility (Yeh, Lee, & Ko, 2013). Therefore, the gra- phic icons for this experiment are all in blue and have a white background. The experimenter had made sure that the participants knew the task cle- arly before starting the formal experiment. After completing all the tasks,
Graphic Icon and Information Presentation Types of Hover Feedback Designs 299
Figure 1: The prototype of this experiment.
participants were required to fill out a questionnaire of the System Usabi- lity Scale (SUS). A semi-structured interview was conducted at the end of the experiment.
RESULTS
Analysis of Task Completion Time The first task: “Please find the product with a discounted price of RMB 399 and rated 62% better” is an identifiable task. The results showed no signi- ficant main effect either on the graphic icons (F = 0.21, p = 0.653 > 0.05; η2 = 0.01) or the information presentation types (F = 0.12 p = 0.729 > 0.05; η2 = 0.01). In addition, there is also no significant interaction effect betw- een the graphic icons and the information presentation types (F = 0.28, p = 0.602 > 0.05; η2 = 0.02). The second task: “Please find the product with the lowest stock balance” is a comparative task. The results showed no significant main effect either on the graphic icons (F = 1.91, p = 0.184 > 0.05; η2 = 0.10) or the information presentation types (F = 3.09, p = 0.096 > 0.05; η2 = 0.15). In addition, there is also no significant interaction effect between the graphic icons and the information presentation types (F = 0.02, p = 0.895 > 0.05; η2 = 0.00).
The third task: “Please find out the discounted prices for items with a total stock of 90 and whether shipping is supported”is a comparative and identifi- able task. The results showed no significant main effect either on the graphic icons (F = 0.54, p = 0.473 > 0.05; η2 = 0.03) or the information presen- tation types (F = 0.98, p = 0.335> 0.05; η2 = 0.05). However, there is a significant interaction effect between the graphic icons and the information
300 Zhai and Chen
Figure 2: The interaction diagram between the graphic icons and the information presentation types regarding Task 3 completion time.
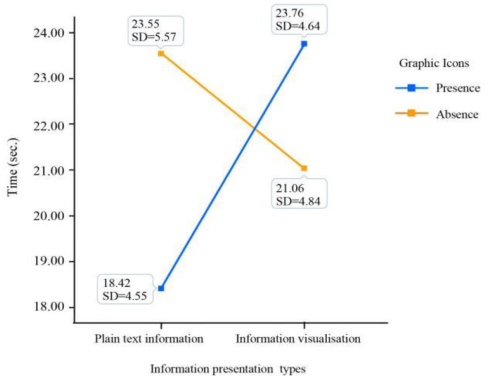
presentation types (F = 5.56, p = 0.030<0.05; η2 = 0.24). Figure 2 illustra- tes that in plain text information, the task completion time for the absence of graphic icons (M = 23.55, SD = 5.57) was significantly higher than that of the presence of graphic icons (M = 18.42, SD = 4.55). However, in informa- tion visualization, the task completion time for the absence of graphic icons (M = 21.06, SD = 4.84) was significantly lower than that of the presence of graphic icons (M = 23.76, SD = 4.64).
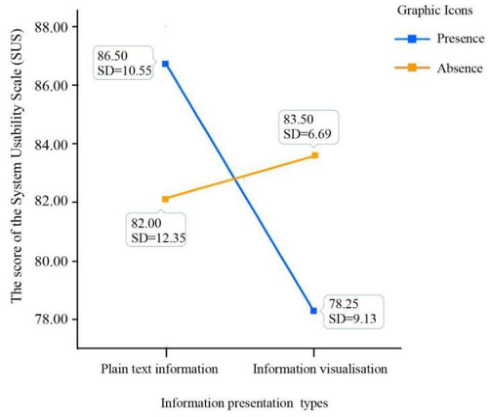
Analysis of The System Usability Scale Questionnaire After the SUS questionnaire was analyzed, the overall mean score (M = 82.56, SD = 9.98) for all groups was above 75, indicating that the two levels of the graphic icons and the two levels of the information presen- tation types revealed high system usability by the participants. The results showed no significant main effect either on the graphic icons (F = 0.05, p = 0.827 > 0.05; η2 = 0.01) or the information presentation types (F = 0.68, p = 0.420 > 0.05; η2 = 0.04). However, there is a significant interaction effect between the graphic icons and the information presentation types (F = 8.32, p = 0.010<0.05; η2 = 0.32). Figure 3 illustrates that in plain text infor- mation, the score of the presence of graphic icons (M = 86.50, SD = 10.55) was significantly higher than that of the absence of graphic icons (M = 82.00, SD = 12.35). Nonetheless, in information visualization, the score of the abse- nce of graphic icons (M = 83.50, SD = 6.69) was significantly higher than that of the presence of graphic icons (M = 78.25, SD = 9.13).
DISCUSSIONS The generated results revealed two significant interactions between the gra- phic icons and information presentation types in terms of users’ performance for Task 3, and the scores of the System Usability Scale (SUS). Specifically, it took participants longer task time to complete task 3 for the absence of graphic icons in plain text information than the presence of graphic icons.
Graphic Icon and Information Presentation Types of Hover Feedback Designs 301
Figure 3: The interaction diagram between the graphic icons and the information presentation types regarding the System Usability Scale.
However, the result is the opposite in the condition of information visualiza- tion. In addition, regarding the System Usability Scale (SUS), The significant interaction indicates that the presence of graphic icons when using plain text information was better than the absence of graphic icons. However, the prese- nce of graphic icons when using information visualization was the opposite result. The result is consistent with previous research that adding icons as visual embellishments to data visualizations slowed the speed of users’ visual search (Borgo et al., 2012). The visual features of the information visualiza- tion with icons, which is input through the visual pathway in a bundled form stored in the working memory, consume to some extent more cognitive resou- rces, thus causing an increase in the user’s mental load (Niu et al., 2019). The semi-structured interviews also revealed that the participants were somewhat distracted by the presence of graphic icons in the information visualization. Previous research has shown that divided attention increases the cognitive load on working memory (Patterson, 2012).
CONCLUSION
This study focused on the difference caused by the graphic icons and dif- ferent information presentation types in users’ task performance and SUS evaluation. The generated results revealed that: (1) Graphic icons significan- tly affect users’ task performance. The presence of graphic icons improves users’ task performance more than the absence of graphic icons in plain text information. However, the result is opposite in the condition of information visualization. (2) The analysis of SUS showed a significant interaction effect between the graphic icons and the information presentation types. (3) The presence of graphic icons can significantly provide more efficiency than the absence of graphic icons in plain text information. Nonetheless, the result is
302 Zhai and Chen
opposite in the condition of information visualization. Website designers can use outcomes from this study to apply suitable graphic icons and information presentation types to improve users’ cognitive processing of information Funding: This research received no external funding. Conflicts of Interest: The authors declare no conflict of interest
ACKNOWLEDGMENT
The authors would like to thank all the reviewers for their helpful comments and suggestions.
REFERENCES
Batista, C. R., do Valle Filho, A. M., Mafioletti, A., & Novakoski, M. H. (2019, July).
Icon Design for a Tourism Mobile App. In International Conference on Human- Computer Interaction (pp. 325–330). Springer, Cham. Borgo, R., Abdul-Rahman, A., Mohamed, F., Grant, P. W., Reppa, I., Floridi, L., & Chen, M. (2012). An empirical study on using visual embellishments in visu- alization. IEEE Transactions on Visualization and Computer Graphics, 18(12), 2759–2768. Brooke, J. (1996). SUS-A quick and dirty usability scale. Usability evaluation in
industry, 189(194), 4–7. Groissberger, T., & Riedl, R. (2017). Do online shops support customers’ decision strategies by interactive information management tools? Results of an empirical analysis. Electronic Commerce Research and Applications, 26, 131–151. Huang, S. C., Bias, R. G., & Schnyer, D. (2015). How are icons processed by the
brain? Neuroimaging measures of four types of visual stimuli used in information systems. Journal of the association for information science and technology, 66(4), 702–720. Lavalle, A., Maté, A., Trujillo, J., Teruel, M. A., & Rizzi, S. (2021). A methodology to automatically translate user requirements into visualizations: Experimental validation. Information and Software Technology, 136, 106592. Niu, Y. F., Shi, B. Z., Qiu, L. C., Li, B., Shen, Q. Y., & Xue, C. Q. (2019, May).
Research on Binding Memory of Icon Features Based on Event-related Poten- tial. In Journal of Physics: Conference Series (Vol. 1215, No. 1, p. 012027). IOP Publishing. Patterson, R. E. (2012). Cognitive engineering, cognitive augmentation, and information display. Journal of the society for information display, 20(4), 208–213. Patterson, R. E., Blaha, L. M., Grinstein, G. G., Liggett, K. K., Kaveney, D. E.,
Sheldon, K. C., ... & Moore, J. A. (2014). A human cognition framework for information visualization. Computers & Graphics, 42, 42–58. Plass, J. L., Homer, B. D., Milne, C., Jordan, T., Kalyuga, S., Kim, M., & Lee, H.
(2009). Design factors for effective science simulations: Representation of infor- mation. International Journal of Gaming and Computer-Mediated Simulations (IJGCMS), 1(1), 16–35. Ware, C. (2010). Visual thinking for design. Elsevier. Yeh, Y. Y., Lee, D. S., & Ko, Y. H. (2013). Color combination and exposure time on legibility and EEG response of icon presented on visual display terminal. Displays, 34(1), 33–38. Yin, W., & Xu, B. (2021). Effect of online shopping experience on customer
loyalty in apparel business-to-consumer ecommerce. Textile Research Journal, 00405175211016559.
LISTED IN THE AHFE DIGITAL BOOKSTORE CATALOGUE
Explore the complete digital volume
Usability and User Experience
Read this individual research paper free through the original publisher, or explore the full digital proceedings book.
ISBN 978-1-958651-15-5
Explore this ISBN in the AHFE Bookstore ↗Listed in the July 2026 bookstore catalogue; search by ISBN to confirm current availability · Digital book purchase optional