Xiaoli Chen, Shiyu Chang (2022). Cognitive prediction model for geophysical prospecting instruments’ user interface based on Confirmatory factor analysis. In: Usability and User Experience. AHFE Open Access, vol. 39, pp. 504–512. https://doi.org/10.54941/ahfe1001748
Geophysical prospecting instruments are indispensable in promoting the development of geophysics. The current user interface of geophysical prospecting instruments is still inadequate in user experience design. In this research, we use qualitative and quantitative analysis to develop a model to measure user perception of geophysical instruments. In the first part, through two questionnaire surveys (N=178), a quantitative index system for geophysical prospecting instruments’ user interface is proposed. In the second part, this article uses the Statistical Product and Service Solutions (SPSS) to conduct an exploratory factor analysis (EFA) and presents a conceptual model. This paper uses the Analysis of Moment Structure (AMOS) to construct and optimize the confirmatory factor analysis (CFA) models in the third part. The result of this research is a second-order three-factor confirmatory factor analysis model is proposed. This model explains the user’s cognitive level that affects the interface of geophysical instruments from three dimensions: reasonable layout (R), interaction friendliness (I), visual simplicity (V). According to this cognitive model, designers can better understand users’ mental level in the design stage, and future products will be more in line with user preferences.
Historically, geophysical prospecting plays a crucial role in geophysics, widely used in geophysical fields such as seismic observation, oil exploration, tectonic research, geological engineering. Geophysical prospecting is insepa- rable from geophysical prospecting instruments; some efforts have been made to optimize devices. Ge et al. developed a calibration signal generator and data processing method to improve broadband electromagnetic prospecting equipment’s calibration efficiency and accuracy (Ge et al., 2020). Julian Mar- tinez et al. studied two electro-geophysical prospecting techniques, resistivity tomography and inductive polarization (Martínez et al., 2019). However, the current user experience design of the geophysical prospecting instruments’ interface is still slightly lacking. There is always a gap in the research on the usability and friendliness of the user interface.
Cognitive Prediction Model for Geophysical Prospecting Instruments’ 505
Researchers often adopt style feature extraction to optimize their pro- ducts’ user experience. Ngo et al. centered around the features of 14 two-dimensional interfaces such as balance, equilibrium, and symmetry and described a model for quantitatively evaluating screen formats (Ngo and Byrne, 2001; Ngo et al., 2003). Based on multisensory human-computer interfaces’ functions and features, Liu et al. proposed simplicity and aesth- etics, unity and variety, ease of use and interaction, static and dynamic, rationality, and emotionality (Liu and Zhang, 2019). Thielsch et al. studied the subjective content perception of 60 websites in terms of clarity, likeability, informativeness, and credibility (Thielsch and Hirschfeld, 2019). This resea- rch draws on similar methods and extracts some adjectives from the literature as the experiment’s characteristic words.
The research aims to propose a user cognition prediction model for the operation interface of the geophysical prospecting instruments and provide a theoretical basis and practical aid for designing the user interface and pro- gram evaluation of the geophysical prospecting instruments. The specific content is as follows: 1. Forty-seven feature words and 71 user interfaces of the geophysical prospecting instruments are extracted. 2. A semi-open profes- sional group experiment was conducted with 14 experienced designers. The SPSS analyzes the feature indexes affecting the cognitive user interface. 3. A non-professional group experiment with 164 ordinary users is conducted using a scale questionnaire. 4. SPSS is used to carry out EFA. A user’s conce- ptual model, a cognitive interface index system, is built. 5. AMOS is used to carry out CFA. The first-order structural equation model (SEM) and the second-order structural equation model are established. This research discus- ses the user’s acceptance of geophysical instruments’ operation interface and how the cognitive prediction model helps design and program evaluation of the operation interface.
METHOD
Participants and Materials The experimental subjects are composed of 178 interviewees. The experie- nced group comprises 14 professional designers, and the amateur group shall consist of 164 ordinary random users. Respondents participate in the expe- riment through the questionnaire. The number of helpful nonprofessional users is 138, with males accounting for 36.23% and females accounting for 63.77%. 86.23% of the respondents are 18-25 years old, and 94.93% have received higher education.
This study obtains 118 sets of original wording through literature review and then normalizes the textual language, 47 pack of feature vocabularies is obtained. Normalized words include balanced, equilibrious, symmetrical, cohesive, unified, etc. Simultaneously, one hundred user interface samples of geophysical prospecting instruments are selected through a web search; 71 are obtained and used as materials for experiments.
506 Chen and Chang
Pre-Experiment The article conducts a pre-experiment in which 14 professional designers participated. The experiment aims to identify several interface feature vocabularies and provide unambiguous definitions of the interface feature languages for formal investigations.
The pre-experiment is conducted utilizing a questionnaire. The first part focuses on distinguishing feature vocabulary, including rational and perce- ptual language. Suppose the terminology is defined as a sensible vocabulary; the participants need to choose the corresponding graphic. 13 groups of gra- phic wireframes that can describe the analytical language features are selected as analytical vocabulary (Ngo and Byrne, 2001). Suppose the terminology is a sensual vocabulary; the participant must choose the corresponding descri- ption language. Simultaneously, some semantic descriptions can be selected as options, such as the interface’s shape, color, material, texture, and iden- tification information. The second part of the investigation is a seven-point scale questionnaire, which scores how well the feature vocabulary matches the instrument’s user interface.
Experiment The questionnaire’s reliability statistics and descriptive analysis are condu- cted using SPSS. The Cronbach coefficient is 0.917, and the data is higher than 0.7 (Högberg et al., 2019). Then, the descriptive study examines the quantitative data through the mean or median (Taber, 2018).
This research ranks 47 feature words based on the average value and selects the top 22 feature words to analyze their definitions. The feature vocabulary is rational when the frequency of rational expressions is more than sensual words. Otherwise, it is sensual, and other words are sensual by default. In selecting the terminology’s semantic features, if the percentage of options is more than 50%, the semantics is valid. The interpretation of the characteristic vocabulary is explained in detail. The quantitative index system will provide a reference for the follow-up questionnaire and will be applied to specific product designs (see Table 1).
The study was conducted on 164 non-specialist subjects based on the quantitative index system. The purpose of the experiment is to explore the structure of 22 characteristic words for factor analysis. The exploratory questionnaire is divided into two parts. The first part collects the neces- sary information of participants, including gender, age, and education level. The second part is a seven-point scale questionnaire it investigates the users’ cognitive status. A total of 164 questionnaires are returned in the study, of which 138 are valid questionnaires.
SPSS is used in this study for reliability analysis based on the questionnaire. The Cronbach reliability coefficient is 0.946. This result indicates the high quality of the data. Next, this study conducted exploratory factor analysis (de Graaf et al., 2019), and we finished the validity analysis. The Kaiser- Meyer-Olkin (KMO) value is 0.933, more significant than 0.6, indicating very high validity (Nikolaou et al., 2020). So the data can be applied to spe- cific model construction. The EFA model is constructed in the paper based on
Cognitive Prediction Model for Geophysical Prospecting Instruments’ 507
Table 1. System of quantitative indicators Orders Adjectives Characteristics
Table available in the original PDF paper.
1 Usable a. The steps are simple, easy to use, clear; b. The logo picture is simple and easy to understand; c. Task can be completed efficiently in extreme environments. 2 Friendly a. The interaction method is direct and straightforward; b. Easy to operate, clear instructions, friendly prompts. 3 Ordered a. The interface layout can promote eye movement; b. Upper left-upper right-lower left-lower right; 4 Unified a. Unification of functions, interactions and usage scenarios; b. Elements, forms, and expressions are visually consistent. 5 Clear a. The semantics of interface elements express clearly; b. The logo information is clear and unambiguous; c. The steps are correct and easy to understand. 6 Coordinated a. The elements are harmonious and appropriately matched. 7 Proportional a. The interface elements have beautiful proportions; b. The interface elements distribute densely and densely; 8 Simple a. The elements are straightforward, simple and clear; b. The complexity and degree of change are small; c. The burden of users’ cognition and memory is small. 9 Technical a. The overall high-end, cutting-edge and advanced; b. It can predict behaviors and provide timely assistance. 10 Balanced a. Element distribution and color matching are balanced; b. The ratio of interaction processes and methods; c. The functions meet the actual and practical scene. 11 Modern a. Color matching and texture have a sense of the times; b. It has a sense of the times, and the legibility is strong. 12 Guided a. Interface design follows the rule of a line of sight induction; b. High visual recognition efficiency and accuracy. 13 Equilibrious a. The center of the element and frame are coincident; b. Visual communication meets Gestalt psychology; 14 Rhythmic a. The arrangement of elements is systematic and regular; b. The function conforms to the operation process; c. The arrangement law works for user habits. 15 Harmonious a. The shape, proportion, and color are harmonious; b. The logo information is reasonable and not conflicting; c. The content and form are equivalent. 16 Informational a. The guidance information for the interface use is perfect; b. The identification information is clear. 17 Regular a. The horizontal arrangement of elements is consistent; b. The vertical structure of interface elements is consistent; 18 Compact a. High interface utilization, no extra parts between elements; b. Faster rhythm. 19 Composed a. Have a sense of wholeness; b. Relationship between content. 20 Elegant a. The function of the interface can meet the needs of users; b. The interface elements are highly comfortable; c. The color is advanced. 21 Vigorous a. In operation, timely feedback on visual interaction; b. Future technology sense; c. Energetic and energetic. 22 Pure a. The shape of the elements is unified and concise; b. The color is monotonous, soft and not gorgeous; c. The material is straightforward, simple, and not luxurious; d. The information expresses clearly.
508 Chen and Chang
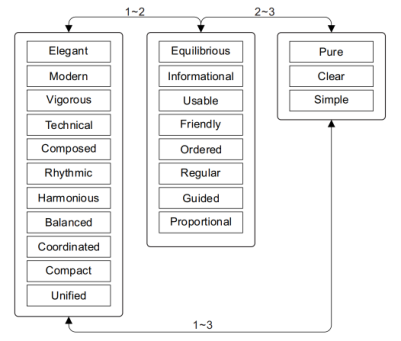
Figure 1: The EFA model.
the exploratory factor analysis results. The 22 characteristics of the interface are divided into three dimensions (see Figure 1).
RESULT
First-Order Factorial Model To evaluate potential cognitive predictive properties, we apply a structural equation model, conduct a validation factor analysis, and construct a first- order oblique three-factor model using AMOS based on the EFA model (Jylhä and Hamari, 2020). We analyzed the aggregation validity, discrimination validity, and common method bias. Q5 to Q26 represents the measurement indicators composed of the 22 characteristic words in Table 1.
All measurement items show significance at the 0.001 level when analyzing convergent model validity. Most of the standardized load factor values were more significant than 0.7, thus indicating good correspondence between the factors and measurement items and good aggregation validity. Some indica- tors related to the model’s aggregate validity, the average variance extracted (AVE), and the CR. AVE and CR values are usually more than 0.5 and 0.7 (Ramírez-Correa et al., 2019). However, in terms of discriminant validity, the square root of the AVE of each construct is not all larger than the corre- lation between the factor and the other factors. According to data analysis results, χ 2/df is 2.076, the comparative fit index (CFI) is 0.888, Tucker- Lewis index (TLI) is 0.871, incremental fit index (IFI) is 0.889, root mean square error of approximation (RMSEA) is 0.089, the root mean square resi- dual (RMR) is 0.094, the Akaike information criterion (AIC) is 521.711, and Bayesian information criterion (BIC) is 659.292. Among them, CFI, TLI, IFI are less than 0.9. RMSEA values of 0.08 or lower are a good fit. Values between 0.08 and 0.10 are a mediocre fit (Bratt and Fagerström, 2020; Neff et al., 2017). The RMSEA is more than 0.08, the RMR is more than 0.05, not within the standard range. And the smaller AIC and BIC, the better. The model is poorly constructed and requires model correction.
Cognitive Prediction Model for Geophysical Prospecting Instruments’ 509
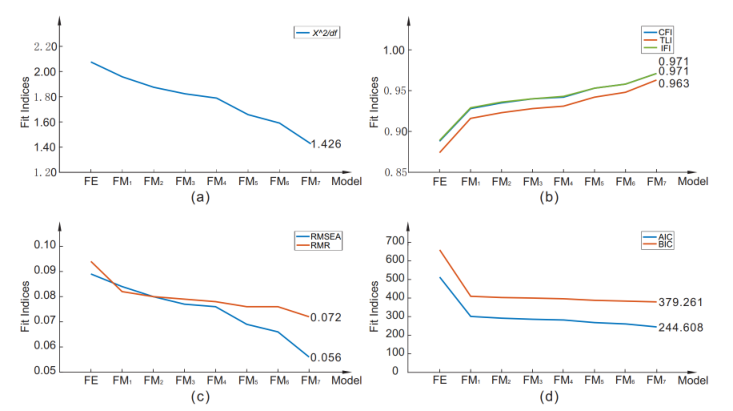
Figure 2: Comparison of models’ fit indices.
The model needs to be corrected due to the low fit values. The model is modified by combining various indicators such as aggregation validity, discri- mination validity, model fit indices, and modification indices (MI). First, the paper removes the measurement items with factor loading coefficients grea- ter than 0.7. Then, based on the actual situation, the measurement items with higher MI coefficients are deleted, or the structure between the model measu- rement items is modified (Brown, 2015). The model is corrected seven times in total. FM1, FM2, FM3, FM4, FM5, FM6, FM7 represent seven correction models. The fit indices are improved (see Figure 2). A final consideration is given to adopting Modified Model 7 (see Figure 3(a)). All the measurements of the modified model 7 show an excellent aggregation effect. The fit indexes of the model also meet the requirements.
However, there is still a gap between the discriminant validity and the expected value. So, the study optimizes the structural model. After two- dimensionality reduction and model modification, the single-factor structural model (FS) is obtained (see Figure 3(b)). The aggregation validity and the model fit metrics of this scale’s data are perfect.
Second-Order Factorial Model There is a high correlation between the oblique multifactor model’s constru- cts in the first-order model. The research further assumes that a higher-order potential trait influences the original multiple first-order factors. On this assumption, this study conducts a second-order confirmatory factor analysis and constructs multiple second-order three-factor structural models.
Based on the EFA model, this paper constructs a second-order three-factor model. Similarly, the model is optimized four times according to its factor loading coefficient, AVE value, CR value, MI correction coefficient, model fit value (see Figure 3(c)). FF1, FF2, FF3, and FF4 represent four second-order
510 Chen and Chang
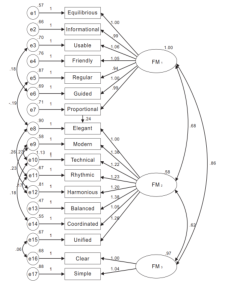
Figure 3: (a) Modified Model 7; (b) Single-factor model 2; (c) Second-order three-factor structural model 4.
models, R represents the acceptance of user perception. About the last model, χ 2/df is 1.626, CFI is 0.957, TLI is 0.948, IFI is 0.958, RMSEA is 0.068, RMR is 0.069, AIC is 234.985, BIC is 343.293. The data indicates that the model fit indices for the optimized second-order three-factor model are excellent for the data.
DISCUSSION
Implications This article proposes a user cognitive prediction model for geophysical pros- pecting instruments’ user interface, which defines the user interface’s usability from reasonable layout, interaction friendliness, and visual simplicity aesthe- tics. Compared with the existing research, this model has certain advantages in two aspects: research objects and influencing factors.
The research object is more precise. Most researchers divide all operation interfaces into one category, which does not target sufficiently. The paper starts with geological equipment takes the user experience defects of the geo- physical instrument interface as the pain point. A method that could design and evaluate the user interface’s usability is proposed. Research factors are more diverse. The research considers the visual aesthetics from the perspe- ctive of interface layout and considers the interactive mode and ease of use of the product from the user experience.
Limitations The research has some limitations which need to be overcome in subsequent analysis. First of all, except for the RMR value, which is slightly higher than the standard value, other indicators are showing excellent status. Relevant research indicates that an insufficient number of subjects may cause the phe- nomenon. Therefore, it is recommended to copy the study and increase the sample size to explore the deviation between the model fitting index and the standard value and increase the model structure’s stability. Second, the model proposed in this article is only aimed at the user interface of geophysical
Cognitive Prediction Model for Geophysical Prospecting Instruments’ 511
instruments commonly used in the current market. With the rapid develo- pment of networking and fast product updates, the model may no longer apply to new products. At that time, the model will be optimized and ite- rated again. Third, the study only samples domestic users when selecting respondents. Under the influence of cultural differences at home and abroad, this model may only apply to domestic populations, and there are certain restrictions on the scope of its use.
CONCLUSION
This paper uses scale questionnaires, reliability analysis, descriptive analysis, validity analysis, exploratory factor analysis, and validation factor analysis to study the user perception acceptance of the geophysical prospecting instru- ments’ interface. This research proposes a cognitive prediction model that interprets the user’s understanding of geophysical tools’ interface from the three dimensions of reasonable layout, interaction friendliness, and aesthetics of visual simplicity.
The model provides the theoretical basis and practical aids for the user interface design and program evaluation of geophysical prospecting instru- ments. In designing the user interface of the geophysical device, the designer can refer to the model and combine the product design method with the user’s cognitive level to effectively optimize the user experience. We will combine the strategies and conclusions obtained to conduct further follow-up resea- rch. The purpose is to provide practical design methods for the geological equipment industry’s ecological chain from designers’ perspective, thereby promoting the earth’s Harmonious development of physical ecology.
REFERENCES
Bratt A and Fagerström C. (2020) Self-compassion in old age: confirmatory factor analysis of the 6-factor model and the internal consistency of the Self-compassion scale-short form. Aging & Mental Health 24: 642–648. Brown TA. (2015) Confirmatory factor analysis for applied research: Guilford
publications. de Graaf MM, Ben Allouch S and Van Dijk JA. (2019) Why would I use this in my home? A model of domestic social robot acceptance. Human–Computer Interaction 34: 115–173. Ge S, Yang R and Guo C. (2020) Fast Calibration Method for Broadband Electroma-
gnetic Prospecting Equipment. In 2020 IEEE International Instrumentation and Measurement Technology Conference (I2MTC) IEEE, 1–5. Högberg J, Hamari J and Wästlund E. (2019) Gameful Experience Questionnaire (GAMEFULQUEST): an instrument for measuring the perceived gamefulness of system use. User Modeling and User-Adapted Interaction 29: 619–660. Jylhä H and Hamari J. (2020) Development of measurement instrument for visual
qualities of graphical user interface elements (VISQUAL): a test in the context of mobile game icons. User Modeling and User-Adapted Interaction 30: 949–982. Liu Y and Zhang Q. (2019) Interface design aesthetics of interaction design. In International Conference on Human-Computer InteractionSpringer, 279–290. Martínez J, Rey J and Sandoval S, et al. (2019) Geophysical prospecting using ERT
and IP techniques to locate Galena veins. Remote Sensing 11: 2923.
512 Chen and Chang
Neff KD, Whittaker TA and Karl A. (2017) Examining the factor structure of the Self-Compassion Scale in four distinct populations: Is the use of a total scale score justified? Journal of Personality Assessment 99: 596–607. Ngo DCL and Byrne JG. (2001) Application of an aesthetic evaluation model to data
entry screens. Computers in Human Behavior 17: 149–185. Ngo DCL, Teo LS and Byrne JG. (2003) Modelling interface aesthetics. Information Sciences 152: 25-46. Nikolaou P, Basbas S and Politis I, et al. (2020) Trip and Personal Characteristics
towards the Intention to Cycle in Larnaca, Cyprus: An EFA-SEM Approach. Sustainability 12: 4250. Ramírez-Correa P, Rondán-Cataluña FJ and Arenas-Gaitán J, et al. (2019) Analysing the acceptation of online games in mobile devices: An application of UTAUT2. Journal of Retailing and Consumer Services 50: 85-93. Taber KS. (2018) The use of Cronbach’s alpha when developing and reporting
research instruments in science education. Research in Science Education 48: 1273–1296. Thielsch MT and Hirschfeld G. (2019) Facets of website content. Human–Computer Interaction 34: 279–327.
LISTED IN THE AHFE DIGITAL BOOKSTORE CATALOGUE
Explore the complete digital volume
Usability and User Experience
Read this individual research paper free through the original publisher, or explore the full digital proceedings book.
ISBN 978-1-958651-15-5
Explore this ISBN in the AHFE Bookstore ↗Listed in the July 2026 bookstore catalogue; search by ISBN to confirm current availability · Digital book purchase optional