Silvia Imbesi, Giuseppe Mincolelli (2022). Design Of A Rehabilitation System Monitoring Gait Of Users With Parkinson’s Disease: Data Visualization As A Methodological Tool. In: Digital Human Modeling and Applied Optimization. AHFE Open Access, vol. 46, pp. 115–119. https://doi.org/10.54941/ahfe1001907
The PASSO project uses a User Centered approach to design and develop a smart system allowing alternative approaches and strategies to the management of motor impairments related to PD. One of the methodological objectives of the project was the improvement of communication in the multidisciplinary team working for the system development. In this paper authors describe how data visualization was used as a project tool giving some benefits as quick information comprehension, a deeper understanding of important factors influencing next stages of the project, a bigger involvement of the group members in the project, and, finally, an increased possibility of achieving results quickly and cheaply, due to more accessible information. In the paper is reported a case study of data representation used in the PASSO project for the communication of results obtained from the testing protocol to the multidisciplinary team.
The PASSO (PArkinson Smart Sensory-cues for Older-users) project aims to design and test a system submitting multi-sensory cues to persons with Par- kinson’s Disease (PD) training, rehabilitating and monitoring their gait and posture (Imbesi et al., 2021).
PD usually affects persons’ motor abilities, causing impairments in the gait and compromising postural balance (Jankovic, 2008). Parkinson’s symptoms differ from one person to another, and change as the disease progresses (Mas- sano & Bhatia, 2012). In addition to pharmacological therapies, training and rehabilitating sessions practiced regularly can decelerate the disease effects on the person. In order to obtain a higher benefit from motor activities, it is necessary to plan sessions following needs and requirements of the specific user (Cassimatis et al., 2016; Corzani, 2021).
The PASSO project uses a User Centered approach to design and develop a smart system allowing alternative approaches and strategies to the manage- ment of motor impairments related to PD (Imbesi et al., 2021). The adopted
design process consisted in iterative design cycles, each one composed of four phases: planning (P1), analyzing (P2), creating (P3), and verifying (P4) (Norman & Draper, 1986; User-Centered Design Process Map, 2013).
The project is still ongoing, but until now almost twenty users were invo- lved in testing protocols, using the Android-based smart system to practice gait and postural training sessions. The users involvement in the design pro- cess allowed to consider their needs since the early stages of the design process.
One of the methodological objectives of the PASSO project was the impro- vement of communication in the multidisciplinary team working for the system development. The team was primarily composed of technical ope- rators (design and engineering) working with medical operators (neurology and geriatrics), with the help of some users (patients with PD and volunteers).
REPRESENTING DATA LINKED TO SPECIFIC TECHNICAL PARAMETERS Sometimes communication between professionals coming from different technical fields could become ineffective. Usually the primary issue is to pro- perly communicate information regarding their own work, explaining clearly the results they obtained, in order to allow the whole group to effectively understand the contribution to the project and take from it the best advantage (Mason, 2019).
Especially in the field of monitoring technologies, it is important to give to all involved professionals the possibility of understanding and interpreting collected data, to obtain from them information useful in their own field of knowledge and give a pertinent and focused personal contribution.
Data visualization is the translation of data in visual graphs, layouts, maps, etc., to make data comprehension easier for people and allow an intuitive interpretation of them. Data visualization allows the possibility of recogni- zing trends and patterns considering a huge amount of data that would be impossible to manage for the human brain (Engebretsen & Kennedy, 2020). The scope is to provide a communication tool for information, using the visual channel in a universally accessible way.
In a multidisciplinary working group, data visualization can give some benefits for the project development as a quick information comprehension, promoting highlights and speed up important decisions; a deeper understan- ding of important factors influencing next stages of the project, improving the project organization; a bigger involvement of the group members in the project, thanks to a higher understanding of information; and, finally, an increased possibility of achieving results quickly and cheaply, due to more accessible information (Gershon & Page, 2001; Goodman et al., 2007; Mason, 2019).
DATA REPRESENTATION IN THE PASSO PROJECT The first part of the PASSO project regarded the design and test of diffe- rent sensory feedback based on three sensory channels: visual, auditory and
Design of a Rehabilitation System Monitoring Gait of Users 117
vibratory. The aim of this stage of the project was to understand if and how each signal influences the gait of people with PD.
After designing feedback, technical operators elaborated a testing proto- col to collect data collected during the submission of the different categories of signals. Specifically, users with PD were asked to wear sensors on feet and walk along a straight path for at least 30 steps (corresponding on ave- rage to about 25 meters). Data were collected from Inertial Measurement Units (IMUs) positioned on the person’s shoes, and then transmitted to the Android-based system.
Once users practiced the testing protocol, collected data were shared with the whole multidisciplinary team after a quick process of data visualization. The objective of this last step was to maximize the quick intuitive compre- hension of collected data to allow the project group to share opinions and hypothesize common users’ behaviors while receiving sensory cues.
During the testing protocol several parameters about the users’ gait were collected, combined and compared to be used for the evaluation of cues impact (cadence, velocity, asymmetry, step length, etc.). Among these para- meters, the “Number of steps to reach the right cadence” is reported as a case study in this paper.
Number of Steps to Reach the Target Cadence This parameter is defined as the “Number of steps needed to hold the users’ cadence within a value of 95-105 steps/min (target cadence 100 steps/min) for at least 5 steps”. If there was no alignment during the test, it was reported a value of 30 steps, corresponding to the maximum number of steps taken after the signal.
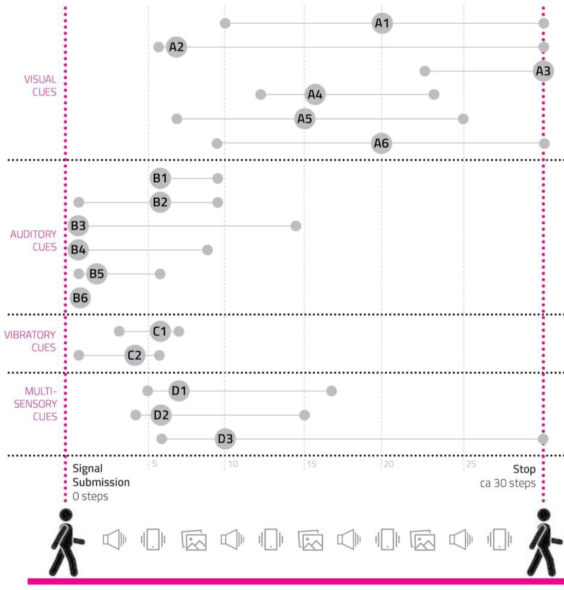
It was decided to represent data in a scheme where a man silhouette walks for thirty steps. The different categories of sensory cues are reported on the left, each one including several prototypes of sensory cues named with a letter (visual cues: A; auditory cues: B; vibratory cues: C; multisensory cues: D). In the image every cue prototype corresponds to a line correcting three circles: the first one on the left represents the user reaching the target cadence with the lowest number of steps; the second circle is bigger and shows the cue code, standing for the average number of steps users needed to reach the cadence; the last small circle indicates the user needing the highest number of steps to reach the cadence.
Thanks to this application of data visualization, it was possible to under- stand in a sight which typology of cues reached best results, helping users to align quickly to the suggested signal. Auditory cues gave the best performa- nces, followed by vibratory, multisensory and visual ones.
CONCLUSION
The development of a data visualization strategy in the PASSO project was a useful tool for an effective sharing of technical information among the multidisciplinary team. The team involvement grew thanks to the effective improvement of data accessibility, and professionals were able to quickly
118 Imbesi and Mincolelli
Figure 1: Graphic representation of the average number of steps every user needed to reach the target cadence under the influence of a sensory biofeedback.
recognize significant aspects of the project and knowingly focus on specific issues.
Data visualization is a very useful design tool, especially if applied to the healthcare field, including researchers coming from different fields of know- ledge that need to dialogue and share information. In this process, numerical data is transformed into graphical signs to suggest a qualitative message about data evidence. The simplification of data complexity allows making comparisons and understanding causality, making it accessible to the human mind.
REFERENCES
Cassimatis, C., Liu, K. P. Y., Fahey, P., & Bissett, M. (2016). The effectiveness of external sensory cues in improving functional performance in individuals with Parkinson’s disease: A systematic review with meta- analysis. International Journal of Rehabilitation Research, 39(3), 211–218. https://doi.org/10.1097/MRR.0000000000000171 Corzani, M. <1991>. (2021). MHealth-based Methods for Neuromotor Assessment and Rehabilitation [Doctoral Thesis, Alma Mater Studiorum - Università di Bologna]. http://amsdottorato.unibo.it/9640/ Engebretsen, M., & Kennedy, H. (2020). Data Visualization in Society. Amsterdam
University Press. https://doi.org/10.5117/9789463722902
Design of a Rehabilitation System Monitoring Gait of Users 119
Gershon, N., & Page, W. (2001). What storytelling can do for infor- mation visualization. Communications of the ACM, 44(8), 31–37. https://doi.org/10.1145/381641.381653 Goodman, J., Langdon, P., & Clarkson, P. J. (2007). Formats for user data in inclusive design. Proceedings of the 4th International Conference on Universal Access in Human Computer Interaction: Coping with Diversity, 117–126. Imbesi, S., Corzani, M., Petrocchi, F., Lopane, G., Chiari, L., & Mincolelli, G.
(2021). User-Centered Design of Cues with Smart Glasses for Gait Rehabilitation in People with Parkinson’s Disease: A Methodology for the Analysis of Human Requirements and Cues Effectiveness. In J. L. Wright, D. Barber, S. Scataglini, & S. L. Rajulu (Eds.), Advances in Simulation and Digital Human Modeling (pp. 348–358). Springer International Publishing. https://doi.org/10.1007/978-3- 030-79763-8_42 Jankovic, J. (2008). Parkinson’s disease: Clinical features and diagnosis. Journal of Neurology, Neurosurgery, and Psychiatry, 79(4), 368–376. https://doi.org/10.1136/jnnp.2007.131045 Mason, B. (2019). Why scientists need to be better at data visualization. Knowable Magazine | Annual Reviews. https://doi.org/10.1146/knowable-110919-1 Massano, J., & Bhatia, K. P. (2012). Clinical Approach to Parkinson’s Disease: Fea-
tures, Diagnosis, and Principles of Management. Cold Spring Harbor Perspectives in Medicine, 2(6), a008870. https://doi.org/10.1101/cshperspect.a008870 Norman, D. A., & Draper, S. W. (1986). User Centered System Design; New Perspectives on Human-Computer Interaction. L. Erlbaum Associates Inc. User-Centered Design Process Map. (2013, December 18). Department of Health
and Human Services. https://www.usability.gov/how-to-and-tools/resources/ucd- map.html
LISTED IN THE AHFE DIGITAL BOOKSTORE CATALOGUE
Explore the complete digital volume
Digital Human Modeling and Applied Optimization
Read this individual research paper free through the original publisher, or explore the full digital proceedings book.
ISBN 978-1-958651-22-3
Explore this ISBN in the AHFE Bookstore ↗Listed in the July 2026 bookstore catalogue; search by ISBN to confirm current availability · Digital book purchase optional