Yujia Li (2023). The visual beauty of text overlay images of different proportions of pictures. In: Intelligent Human Systems Integration (IHSI 2023): Integrating People and Intelligent Systems. AHFE Open Access, vol. 69, pp. 591–598. https://doi.org/10.54941/ahfe1002881
Perceived visual aesthetics is of great significance for the design of human-computer interaction interface. There is much research on interface aesthetics in the academic community. There is evidence that perceived visual aesthetics has an important impact on user experience and interaction, and many scholars have put forward the calculation model of perceived visual aesthetics. This study research the text overlay image. Compared with the traditional text surround image, the text overlay image changes the visual perception aesthetics of the image by embedding the text into the image. Text overlay image is usually superimposed on the image by a piece of text or several pieces of text, which blocks the background area of the image and affects the overall interface aesthetics. However, the text overlay image is applied to various places. In this study, the background white space calculation model (WBB) based on bounding box is used to calculate the perceived visual aesthetics. Explore the visual aesthetics of text overlay images under three proportions: golden section ratio (1:0.618), root mean square ratio (1:0.707) and integer ratio (1:1). The experiment uses the calculation model to obtain the proportion of the blank area of the text covered image in the image background. The subjects' subjective evaluation of different proportion interfaces is obtained through the Likert scale. The results of the two are compared to obtain the proportion of the optimal visual beauty under the text covered image. The results show that: ① in terms of the image length width ratio, the visual aesthetics of the text overlay image with the length width ratio of 1:0.618 is better when the text line spacing is 1 times, and the visual aesthetics of the image with the length width ratio of 1:0.707 is better when the text line spacing is 1.5 times. When the line spacing is 1 and 1.5 times, the visual aesthetics of the image with length width ratio of 1:1 is the worst; ② In terms of line spacing, when the line spacing is the same (1 or 1.5 times the line spacing), the subjects think that the proportion of the blank area of the text covered image with high visual aesthetics in the image background is 0.7218-0.9040. When the line spacing is different (1 and 1.5 times the line spacing), it can be speculated that the visual aesthetics of the text covered image is closely related to the blank area of the image background, In order to obtain a text overlay image with high visual aesthetics, we should consider not only the proportion of the image, but also the blank area of the image background.
The interface is an indispensable role in the Internet era. The aesthetics of the interface is an important aspect that affects the user’s use of the interface system. More and more researchers begin to emphasize the role of aesthetics in interface design and investigate the overall experience of users when inte- racting with the computer system (Liu, 2003). Liu comprehensively reviewed the main schools of aesthetic theory and the relationship between aesthe- tic design and human factors engineering (Liu, 2003). Many studies have explored the relationship between different layout elements, such as visual balance, symmetry, simplicity, rhythm and perceptual aesthetics (Bauerly and Liu, 2006). In the research field, there have been some evidences suppor- ting the positive role of aesthetics in interface interaction. Hassenzahl has conducted two studies, believing that usability, stimulation and satisfaction interact with the user’s perception system (Hassenzahl, 2004). Eytam has studied how interactive products have different levels of visual simplicity (VSL), evaluating ease of use, functionality and aesthetics, The results show that aesthetics has a prominent visual simple level in all people’s preference process (Eytam et al. 2017). Karvonen showed how simplicity and beauty affect user experience and design interpretation, and thought about how this perception changes according to cultural background, age and the num- ber of user experiences (Karvonen, 2000). Ben Bassat’s experiment proves that the availability of the system will affect the evaluation of usability and aesthetics, and the aesthetics of the system will also affect the evaluation of aesthetics and usability (Ben-Bassat and Meyer, 2006). Lavie tries to under- stand the relationship between design factors’ emotional responses to web pages or other graphical user interfaces, using uncontrollable real-world sti- muli (Lavie and Tractinsky, 2004). Hartmann proposed a user design quality judgment framework based on adaptive decision theory, proving that user judgment is vulnerable to the frame effect of tasks and their backgrounds (Hartmann, 2008).
The text is on the image. The problem studied in this paper is the impact of image size on the aesthetics of interface layout when the text covers the image. Previous studies have shown that “average visual balance”and “white space” are important indicators that affect the aesthetics of text covered ima- ges, but previous studies are based on an image size ratio. As the golden section ratio, root mean square ratio and integer ratio are the three most com- monly used proportions in interface design, this paper discusses the golden section ratio, root mean square ratio and integer ratio in text covered ima- ges, and explores which proportion of text covered images has higher visual beauty.
CALCULATION MODEL OF BLANK SPACE In a previous study (2014), Tsai et al. Proposed a calculation model WBB= (AB-Abox)/AB based on the background white space of bounding box is defined as the area ratio between the boundary rectangle of the text and the background area of the image, where AB represents the area of the background in the image, and Abox represents the area of all the text as
The Visual Beauty of Text Overlay Images of Different Proportions of Pictures 593
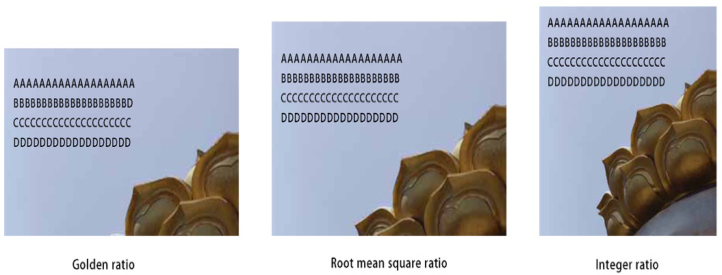
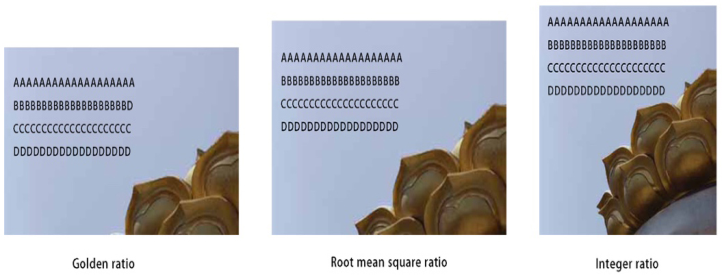
Figure 1: The text overlay image with 1 line spacing.Figure 2: The text overlay image with 1.5 line spacing.
a rectangle. The calculation model can effectively simulate the subjective aesthetic attraction.
EXPERIMENTAL OVERVIEW In this study, two experiments were conducted: Experiment 1 and Experi- ment 2. In each experiment, the line spacing of the text was 1 time of the line spacing and 1.5 times of the line spacing, respectively, to determine the visual beauty of the image covered by the text. The experiment selects three image scales: golden section ratio (1:0.618), root mean square ratio (1:0.707) and integer ratio (1:1), each scale is superimposed with 1 and 1.5 times spaced text, as shown in Figures 1 and Figure 2. The size of each image is 300 * 185 pixels, 300 * 212 pixels, and 300 * 300 pixels respectively. Each image is covered with a piece of text and displayed to the experimenter as a stimulus. For each picture, use the “MagicWand” area selection tool in PS to identify the background area for placing text. This experiment mainly obtains the aesthetic value through subjective evaluation. From left to right, the Likert scale is divided into seven grades: “very beautiful”, “relatively beautiful”, “beautiful”, “non feeling”, “not beautiful”, “relatively not beautiful”, and “very not beautiful”. Subjects were asked to use the 7-level Likert scale to
594 Li
subjectively evaluate each picture, and the beauty value of the subjective evaluation was obtained.
SUBJECTS In Experiment 1, there were 10 subjects (mean age 23 years, range 21-24 years; 5 males and 5 females). In Experiment 2 (1.5 row spacing), there were 10 subjects (mean age 23 years, range 21-24 years; 5 males and 5 females). All subjects had normal or corrected vision and normal color vision. The subjects are students of Southeast University. Art and architecture students are not allowed to participate in the experiment to avoid any potential impact of specialized aesthetic training or background.
STIMULATION All the images used in the experiment have a clear perceptible background area, and the background area is enough to place text. Each image is pro- perly placed with text, try not to block the main prominent object of the given image. In order to reduce the influence of irrelevant variables on the experimental results, the text in the image should be placed in the same posi- tion, with the same number of lines. The text should be pixelated so that it does not contain any semantics, as shown in figures 2, 3 and 4.
PROCESS The experiment was conducted in a well lit room. A PowerPoint file was used to display the test image and Likert scale, and the scores given by the subjects were recorded. Each subject sat at a table and watched a 15.6-inch screen with a resolution of 1920 * 1080. The sizes of the test images were 300 * 185 pixels, 300 * 212 pixels and 300 * 300 pixels, respectively. Subjects were told to make judgments based on the overall layout of the text overlay image, rather than the content of the image or text. The details of the text overlay image should not significantly affect or disperse the perception of the subjects in the experiment, so the resolution of the image should be kept at a medium value to meet this purpose. In the process of testing, three scale images of each image appear at the same time, arranged horizontally, and different types of images appear randomly.
EXPERIMENTAL RESULTS
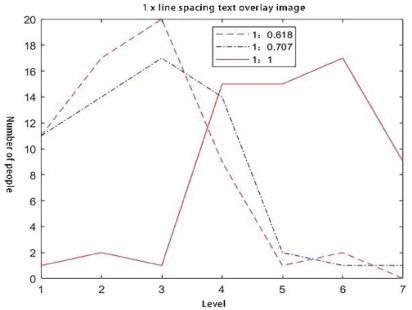
Figure 3 shows the evaluation of each aspect ratio image when the text line spacing of the text overlay image is one time of the line spacing. It can be concluded from Figure 3 that when the aspect ratio of the image is 1:0.618, that is, the golden section ratio, the subjects think that the image with this aspect ratio is “beautiful”, “more beautiful” and “very beautiful”. When the aspect ratio of the image is 1:0.707, that is, the root mean square ratio, the subjects think that the image with this aspect ratio is “insensitive”, “beau- tiful”, “more beautiful” and “very beautiful” When the aspect ratio of the image is 1:1, that is, the integer ratio, the subjects think that the image
The Visual Beauty of Text Overlay Images of Different Proportions of Pictures 595
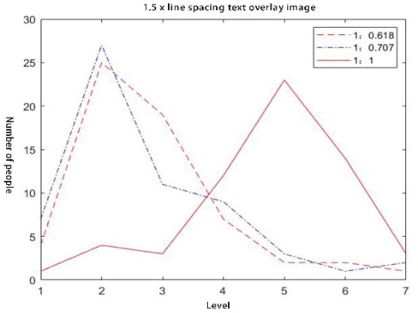
Figure 3: The text overlay image with 1 line spacing.Figure 4: The text overlay image with 1.5 line spacing.
with this aspect ratio is “insensitive”, “not beautiful”, “relatively not beau- tiful”, “very not beautiful”. Table 1 shows the proportion of the blank area of the image to the background when the text line spacing of the text overlay image is one time of the line spacing. It can be seen from Table 1 that when the aspect ratio of the image is 1:0.618, the proportion of the image blank area in the image background is between 0.7490-0.9040; when the aspect ratio of the image is 1:0.707, the proportion of the image blank area in the image background is between blank area in the image background is between 0.8203-0.9437. Figure 4 shows the evaluation of each aspect ratio image when the text line spacing of the text overlay image is 1.5 times of the line spacing. It can be concluded from Figure 4 that when the aspect ratio of the image is 1:0.618, that is, the golden section ratio, the subjects think that the image with this aspect ratio is “beautiful”, “relatively beautiful” and “very beau- tiful”. When the aspect ratio of the image is 1:0.707, that is, the root mean square ratio, the subjects think that the image with this aspect ratio is “beau- tiful” “Relatively beautiful” and “very beautiful”. When the aspect ratio of
596 Li
Table 1. The ratio of the blank with 1 line spacing.
Table available in the original PDF paper.
Type Figure1 Figure2 Figure3 Figure4 Figure5 Figure6
0.9046 0.7844 0.8504 0.9061 0.9177 0.9107
Golden ratio (1:0.618) 0.8977 0.7490 0.8337 0.8879 0.9040 0.8943 Root mean square ratio (1:0.707) Integer ratio (1:1) 0.9204 0.8203 0.8814 0.9386 0.9437 0.9406
Table 2. The ratio of the blank with 1.5 line spacing.
Table available in the original PDF paper.
Type Figure1 Figure2 Figure3 Figure4 Figure5 Figure6
0.8769 0.7218 0.8069 0.8788 0.8938 0.8848
Golden ratio (1:0.618) 0.8680 0.6761 0.7855 0.8553 0.8761 0.8636 Root mean square ratio (1:0.707) Integer ratio (1:1) 0.8972 0.7682 0.8469 0.9207 0.9274 0.9234
the image is 1:1, that is, the integer ratio, the subjects think that the image with this aspect ratio is “not beautiful”, “relatively not beautiful” and “very not beautiful”. Table 2 shows the proportion of the blank area of the image to the background when the text line spacing of the text overlay image is 1.5 times of the line spacing. It can be seen from Table 2 that when the aspect ratio of the image is 1:0.618, the proportion of the image blank area in the image background is between 0.6761-0.8761; when the aspect ratio of the image is 1:0.707, the proportion of the image blank area in the image back- ground is between 0.7218-0.8938; when the aspect ratio of the image is 1:1, the proportion of the image blank area in the image background is between 0.7682-0.9274.
DISCUSSION OF RESULTS When the line spacing of the text is 1 times, the images with aspect ratio of 1:0.618 and 1:0.707 are generally beautiful. The images with aspect ratio of 1:0.618 feel more beautiful than the images with aspect ratio of 1:0.707, because in the images with aspect ratio of 1:0.707, the number of senseless images is more. At this time, the proportion of blank area in the image back- ground is between 0.7490-0.9040, and the aspect ratio is 1:1 on the whole, the image of the world is not beautiful. When the line spacing of the text is 1.5 times, the image with the aspect ratio of 1:0.618 is beautiful on the whole, and the image with the aspect ratio of 1:0.707 is more beautiful on the whole. At this time, the ratio of the blank area of the image to the image background is between 0.7218-0.8938, while the image with the aspect ratio of 1:1 is not beautiful on the whole. This shows that the proportion of the blank area of the image with high visual beauty to the image background is between 0.7218-0.9040.
For the image with the aspect ratio of 1:0.618, the image with the text line spacing of 1.5 times has the same aesthetic feeling as the image with the text line spacing of 1 times, because according to the experimental results, the image with the text line spacing of 1.5 times has the same number of
The Visual Beauty of Text Overlay Images of Different Proportions of Pictures 597
beautiful images as the image with the text line spacing of 1 times. For images with aspect ratio of 1:0.707, images with text line spacing of 1.5 times are more beautiful than images with text line spacing of 1 time, because from the experimental results, images with text line spacing of 1.5 times are more beautiful than images with text line spacing of 1 times. For images with aspect ratio of 1:1, images with text line spacing of 1.5 times are more beautiful than images with text line spacing of 1 time. The visual beauty perception of images with one line spacing is not high, because the experimental results show that the number of images with one line spacing of 1.5 times and one time is relatively large. Due to the different proportion of the image perceived by the text coverage image with different line spacing, it can be speculated that the visual beauty of the text coverage image is closely related to the blank area of the image background. In order to get a text overlay image with high visual beauty, not only the scale of the image, but also the blank area of the image background should be considered.
CONCLUSION
In this paper, the problem is which aspect ratio is the best among the text coverage images with aspect ratio of 1:0.618, 1:0.707 and 1:1. The experi- ment results show that the visual beauty of the text coverage image with the aspect ratio of 1:0.618 is better when the text line spacing is 1 times and 1.5 times respectively. When the space between lines is 1.5 times, the image with aspect ratio of 1:0.707 has better visual beauty. When the line spacing is 1 and 1.5 times, the visual beauty of the image with the aspect ratio of 1:1 is the worst. This experiment is not rigorous, such as the type of image aspect ratio is too few, the number of text is single, hope to improve in the future experiment.
ACKNOWLEDGMENT
This work is supported by the Natural Science Foundation of Jiangsu Province under Grant No. BK20202007.
REFERENCES
Bauerly, M., & Liu, Y. (2006). Computational modeling and experimental investigation of effects of compositional elements on interface and design aesthetics. International Journal of Human Computer Studies, pp. 670–682. Eytam, Eleanor, Tractinsky, Noam, & Lowengart, Oded. (2017). The paradox of
simplicity: Effects of role on the preference and choice of product visual simplicity level. International Journal of Human-Computer Studies, pp. 43–55. Hartmann, Jan, Sutcliffe, Alistair & Angeli, Antonella. (2008). Towards a theory of user judgment of aesthetics and user interface quality. ACM transactions on computer-human interaction, Volume 15 No. 4. Karvonen, K. (2000). The beauty of simplicity. In: Proceedings of the 2000 ACM
Conference on Universal Usability, Virginia, pp. 85–90. Lavie, T. and Tractinsky, N. (2004). Assessing dimensions of perceived visual aesthetics of web sites. International Journal of Human-Computer Studies, pp. 269–298.
598 Li
M. Hassenzahl. (2004). The interplay of beauty, goodness, and usability in interactive products. Human-Computer Interaction, Volume 19 No. 4. T. Ben-Bassat, J. Meyer, N. (2006). Tractinsky. Economic and subjective measures of
the perceived value of aesthetics and usability. ACM Transactions on Computer- Human Interaction, Volume 13 No. 2. Tsai, Mien-Tsung, Wang, Kuo-An, Liu, Yili, & Hong, Jen-Shin. (2014). Perceived Visual Aesthetics of Text-Overlaid Images: Computational Models and Expe- rimental Research for White-Space Fraction. International Journal of Human- computer Interaction, Volume 30 No. 1. Y. Liu. (2003). The aesthetic and the ethic dimensions of human factors and design
Ergonomics, pp. 1293–1305. Y. Liu. (2003). Engineering aesthetics and aesthetic ergonomics: theoretical foundations and a dual-process methodology. Ergonomics. pp. 1273–1292.
LISTED IN THE AHFE DIGITAL BOOKSTORE CATALOGUE
Explore the complete digital volume
Intelligent Human Systems Integration (IHSI 2023): Integrating People and Intelligent Systems
Read this individual research paper free through the original publisher, or explore the full digital proceedings book.
ISBN 978-1-958651-45-2
Explore this ISBN in the AHFE Bookstore ↗Listed in the July 2026 bookstore catalogue; search by ISBN to confirm current availability · Digital book purchase optional