Joy Richardson, Jisun Kim, Henrietta Howarth, John Preston (2023). The Iconography of Mobility as a Service (MaaS) - A Focus Group Study. In: Intelligent Human Systems Integration (IHSI 2023): Integrating People and Intelligent Systems. AHFE Open Access, vol. 69, pp. 628–637. https://doi.org/10.54941/ahfe1002885
Transportation Research Group, Civil, Maritime, Environmental Engineering and Science, Faculty of Engineering and the Environment, University of Southampton, Southampton, UK ↗
Mobility as a Service (MaaS) smartphone applications (apps) are designed to allow users to plan, book, pay for and navigate journeys across a range of travel modes including own or shared car, active travel (walking, running and cycling), micromobility (e-scooters and e-bikes) and public transport. By giving the user trip-specific information about each mode it is hoped MaaS may provide a solution to increasing the use of sustainable travel options whilst encouraging active travel, thereby reducing car use. MaaS apps are being adopted to help develop healthy, liveable urban spaces worldwide.Typically in app design, due to the limited screen size of a mobile phone, icons are frequently used to depict physical artefacts such a vehicle types and items in the real-world environment but also to convey the non-physical such as instructions and waiting times. Icons are used for these purposes as they take up less space than text and should be able to be universally understood. In order to make MaaS accessible to all members of the community icons need to be easily interpreted without the need for prior knowledge or learning. As these apps are being developed concurrently by both commercial and public organisations in many countries it is becoming clear that the icons used within the interface by developers vary a great deal. Yet it is not clear which of the icons are most effective in conveying specific meanings. In order to determine which icons should be used in a new MaaS app currently in development six focus groups were held in which members of the public were asked to comment on a variety of icons from three MaaS apps. 22 participants were recruited of which 14 were women and 8 men. This followed a model which had been previously used in the icon design in interfaces for automated driving. The participants considered the icons out of context individually in workbooks and then in context as a group, explaining what they thought the meaning was, based on form, interpretations based on colour and the ability to be understood by a diverse population. Finally, in a group discussion, participants compared icons from each of the different apps that were intended to have similar meanings. This was in order to understand which elements they liked, disliked and their preferred choice of icon. The participant’s comments were thematically analysed and commonly occurring design aspects were identified. These included confusion arising from the use of almost identical icons representing different artefacts across different apps, for example a bus representing a vehicle in some apps and a bus stop in others. Findings suggested concepts such as multi-modal travel or all public transport were considered hard to represent graphically and needed text labels. The most commonly discussed topic related to the use of colour. Discussions indicated lessons learnt by the participants from other domains were applied to the icons in the MaaS app. This meant the use of colour was imbued with meaning even where none was intended, particularly the use of red where it was frequently interpreted this meant that there were problems with those services such as delays or cancellations. Results of this study were used to develop a set of design guidelines for future icon design within MaaS Apps.
Mobility as a Service (MaaS) smartphone applications (apps) are designed to allow users to plan, book, pay for and navigate journeys across a range of travel modes including own or shared car, active travel (walking, running and cycling), micromobility (e-scooters and e-bikes) and public transport. By giving the user trip-specific information about each mode it is hoped MaaS may provide a solution to increasing the use of sustainable travel options whilst encouraging active travel, thereby reducing car use. MaaS apps are being adopted to help develop healthy, liveable urban spaces worldwide.
Typically in mobility app design, due to the limited screen size of a mobile phone, icons are frequently used to depict physical artefacts such a vehi- cle types and items in the real-world environment but also to convey the
The Iconography of Mobility as a Service (MaaS) - A Focus Group Study 629
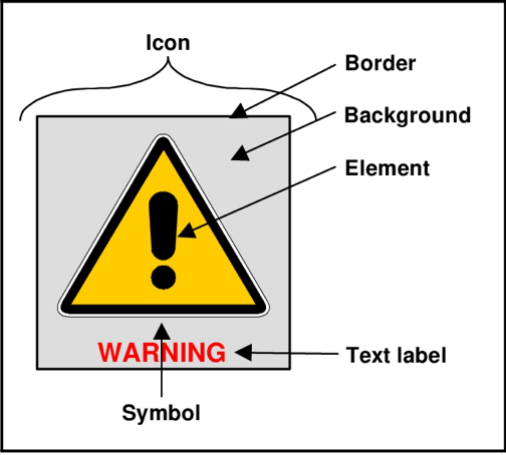
Figure 1: Composition of an Icon (Carney et al 1998).
non-physical such as instructions and waiting times. In order to make MaaS accessible to all members of the community icons need to be easily inter- preted without the need for prior knowledge or learning. As these apps are being developed concurrently by both commercial and public organisations in many countries it is becoming clear that the icons used within the interface by developers vary a great deal. Yet it is not clear which of the icons are most effective in conveying specific meanings.
In order to determine which icons should be used in a new MaaS app currently in development within the Solent area of the UK six focus groups were held in which members of the public were asked to comment on a variety of icons from three MaaS apps. This was in order to understand how easily the icons were understood by a wide range of the population.
The use of pictures to convey meaning is one of the oldest forms of commu- nication, prior to the invention of written languages these pictures would be used to record history and tell stories (Horton 1994, Moser 1998). Icons are a way of using pictures to deliver a specific message and are formed of several elements which can include a border, a back-ground and text but is focused on the pictorial element, known as the symbol as shown in Figure 1 (Carney et al. 1998). Studies have shown that well designed icons can be recogni- sed more quickly and accurately than textual displays (Horton 1994, Carney 1998 Green 1993 & Baber & Wankling 1992) icons also have the benefit of consuming less space than text and, if well designed, can be universally understood.
Carney et al. (1998) suggest Icons can be classified into three types; picto- rial representations of the object or action they represent with meaning easily derived and little effort required to learn. Concept-related icons based on an
Table 1. Iconography focus group demographics.
Table available in the original PDF paper.
Iconography Focus Group Demographics 18–24 25–44 45–64 65+ Female Male Female Male Female Male Female Male Total 3 1 5 4 4 2 2 1 22
18–24 25–44 45–64 65+ Female Male Female Male Female Male Female Male Total 3 1 5 4 4 2 2 1 22
image or a property of an actual object or action, these can be context specific so are more difficult to learn. Arbitrary icons are only meaningful through convention and rely on particular knowledge which can be cultural. These are the most difficult type of icon to learn.
Benefits of standardisation have been shown to include helping overcome language and cultural barriers by providing a method of communication which can surpass them (ISO 2010, Green 1993, Chong et al. 1990). They can improve the image of the product provider (Priest 2006). A combination of divergence and underdeveloped design can cause confusion or distraction (Horton, 1994; Baber & Wankling, 1992; Revell et al., 2019). Poorly desi- gned icons make a system more difficult to use (Horton 1994) increasing workload, errors and stress (Priest et al. 2006) all of which can make a system less usable and useful.
METHOD
Participants Ethical approval was gained via the University of Southampton ethics panel (ERGO No 48777). Six focus groups were held in which members of the public were asked to comment on a variety of icons from three MaaS apps; Citymapper (Citymapper 2022), Sojo (Axon Active 2022) and Breeze app in development stage (Longman & Hillcoat 2022). 22 participants were recrui- ted of which 14 were women and 8 men, within the ages ranges 18–24, 25–44, 45–65 and 65+ to ensure an inclusive sample. Participants were recruited via posters around the university campuses, in community spaces, public libraries and coffee shops and posts on social media. These age groups were chosen in order to align with UK census data and will align with future work within the same project Demographic information for participants is summarised in Table 1.
Design These focus groups followed a model which had been previously used in the icon design in interfaces for automated driving (Richardson 2021). The focus group lasted 2 hours in line with the recommendations of Krueger & Casey (2015) and Morgan (1997a). Socio-demographic information was collected in advance through the completion of an online form and included age range,
The Iconography of Mobility as a Service (MaaS) - A Focus Group Study 631
gender, household structure, attitude to technology and choice of travel mode. The event started with an introduction to the subject of the focus group in line with common practice (Krueger & Casey 2015, Morgan 1997a). The conce- pts of signs and symbols generally and then an introduction to the Solent Future Transport Zone and MaaS. The session then commenced and was formed of three exercises which followed the convention of progressing from structured to less structured (Morgan 1997b, Cooper & Baber 2004).
Equipment Multiple strategies were used for data capture; Two Sony HandyCam video cameras were mounted on tripods close to the group in order to obtain foo- tage and audio recording of the group discussions, a ceiling mounted webcam also captured the sessions and auto transcribed. Written material included workbooks containing images of the icons accompanied by notes written by the participants and comments from the group written by the facilitators on flip charts during the exercises.
Procedure The first exercise was an individual written task, in this the participants were presented with a workbook containing images of icons from the aforementi- oned MaaS Apps each with an adjacent area for writing their response (see appendix 2). These icons were isolated and out of context, the participants were asked to look at the icons in turn and write underneath what they thou- ght they meant. They were instructed to write one meaning, several meanings or that they didn’t know.
The second exercise was a group task where the participants were shown the same icons and some new ones on the presentation screen but in context of screenshots of the apps. They were asked to have a group discussion about the different icons with the following prompts;
- What do you think the icons mean? - Has the context, sometimes including text labels, changed what you think the icons mean? - Is there anything which is confusing or could be difficult to understand? - Do you feel people of different ages, genders or backgrounds would understand the meaning?
The third exercise was also a group task where the participants were shown icons which had been grouped by type with intended similar mea- nings. These included buses, bus stops, trains and all public transport modes. They were asked to have a group discussion about these groups of icons with the following prompts.
- How do you feel about the differences in the way these icons have been designed? - Are there things you particularly like? - Are there things you particularly dislike? - Is there one which you think is most easy to understand?
Table 2. Comparison of meanings attributed to colours.
Table available in the original PDF paper.
Source Red Amber/Yellow Green Caution Standby Focus Group Not Operating Delayed Unsafe Active Safe Eco-friendly ISO 2575 Danger Immediate or Imminent
Caution -
Caution Safe Normal Green et al. (1995) Critical Warning Action Required Horton (1994) Danger Caution Safe
The session finished with an opportunity for the participants to provide any additional feedback, reflect on what they had experienced and to ask any questions.
For the purposes of this paper the authors will focus on the results of the first two exercises concerning correct and incorrect identification of icons.
Method of Analysis The scripts from the written exercise were categorised by icon and the com- ments compared, they were sorted into correct incorrect with the incorrect further sorted thematically so that similar interpretations could be grouped and commonly occurring ideas identified. This process was repeated with the comments from the second exercise.
As colour was of such a concern to the participants a comparison was undertaken between the interpretations of the meaning of colours from the participants’ comments in all exercises, how they are used in the icons used in the focus group, and standards recommended in different design guidelines. The results can be seen in table 2.
RESULTS
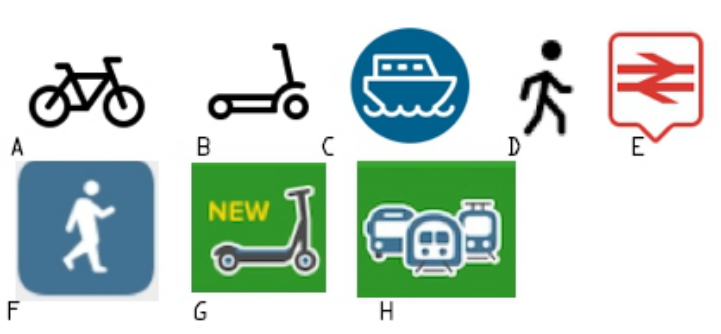
Exercise 1 was the individual task where the participants were presented with 24 icons from the 3 apps out of context. Out of these seven were una- nimously identified correctly (Figure 2). These are all ‘concrete’ icons, they clearly represent what they are meant to mean, even the rail icon (D). Whilst the picture itself is abstract it is a replication of the physical sign at a train station.
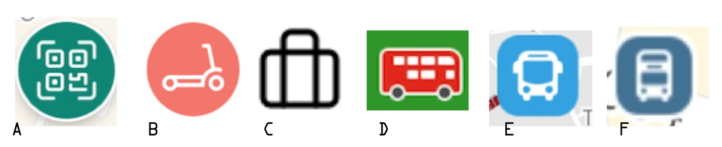
Figure 3 shows six icons which were the most commonly identified incorre- ctly. Icon A is intended to indicate a button which launches a QR code reader, most participants had no idea of the meaning, some suggested it was a map. Icon B is a button which can show, on a map, where the nearest e-scooters are located. However because of the colour it was commonly interpreted to mean than there was a problem with the e-scooters such as they were curren- tly not available or were not allowed to be used in that area. Icon C indicates a personal work location, a user can enter their work location in to app and then this button can be used as a shortcut. This was unanimously thou- ght to mean something related to luggage, such as storage or an allowance.
The Iconography of Mobility as a Service (MaaS) - A Focus Group Study 633
Figure 2: Correctly identified icons from Exercise 1.Figure 3: Commonly incorrectly identified icons from Exercise 1.
Icon D is a button allowing the user to see the next local bus services howe- ver because of the colour it was commonly misinterpreted as indicating that buses were not currently operational or were delayed. Icons E and F both indi- cate bus stops but were more commonly thought to represent the location of buses.
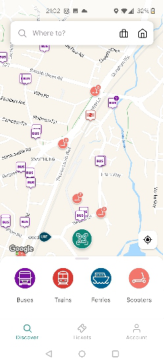
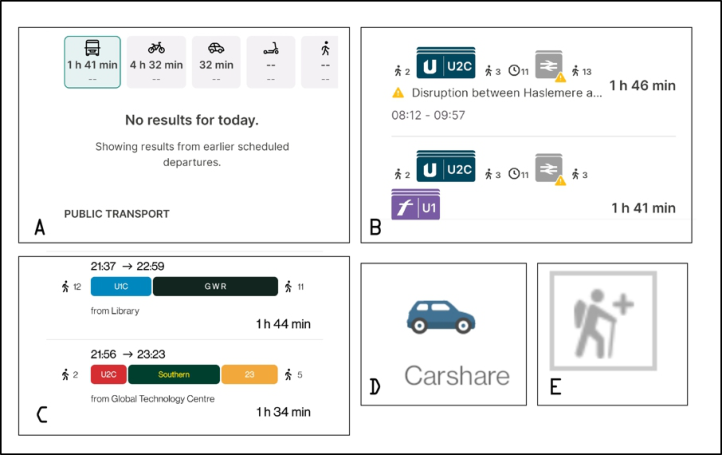
Exercise 2 was the first group task, in this the participants were presented with a total of 34 icons from the three apps in the context of screen shots (as show in Figure 4) and asked to discuss as a group using the aforementio- ned questions as prompts. Being presented with the icons in context did not improve the comprehension of icons A, C, E or F from the previous exercise (Figure 3), although it was considerably better for B and E. Additional icons and collections of icons included in this task can be seen in Figure 5.
Icon A represents ‘Public Transport (all modes)’ however it was considered confusing as it only shows a bus, easy to interpret that this just indicates bus journeys. The text label is not actually part of the icon, only appearing when the icon is selected and also relegated down the page if there are any messages relating to the journey.
B is a collection of icons, those indicating the bus legs of the journeys were difficult to understand and considered to require a lot of local knowledge of the different services available in order to identify them. In particular the logo for the First Bus company (in purple) was thought to represent something to do with a Motorway or intersection.
Figure 4: Examples of MaaS screenshots used in Exercise 2.Figure 5: Additional icons and collections of icons used in Exercise 2.
In image C coloured blocks represent bus and train journeys but again the participants needed a lot of local knowledge to be able to understand that, those who did not already use public transport services struggled the most. The use of colour added to the confusion as it seemed arbitrary and not, for instance, related to the livery of the bus or train company.
Icon D is a very clear icon with a text label, however whilst ‘Carshare’ is a commonly used term in the transportation industry to indicate short- term car hire (car club style) this has a different meaning to the public who consider the term carshare to mean an arrangement as when you have 2 or
The Iconography of Mobility as a Service (MaaS) - A Focus Group Study 635
more people in a single vehicle to the same destination, this could be part of a formal scheme promoted in the workplace or when you borrow the car of a friend or family member.
Icon E was unanimously incorrectly identified. Indicating a ‘long walk’ as part of the journey, it was interpreted to mean either hilly and/or off- road due to the representation of a hiker. However it was also seen to be indicate a route suitable for people with mobility issues due to the walking stick and + symbol (associated with the medical profession). This is almost the opposite of the intended meaning.
The participant’s comments were thematically analysed and commonly occurring design aspects were identified. These included confusion arising from the use of almost identical icons representing different artefacts across different apps, for example a bus representing a vehicle in some apps and a bus stop in others. Findings suggested concepts such as multi-modal travel or all public transport were considered hard to represent graphi- cally and needed text labels. The most commonly discussed topic related to the use of colour. Discussions indicated lessons learnt by the partici- pants from other domains were applied to the icons in the MaaS app. This meant the use of colour was imbued with meaning even where none was intended, particularly the use of red where it was frequently interpreted this meant that there were problems with those services such as delays or cancellations.
Colour of icons was important to the participants and was raised by them in all three exercises. Colour can increase the likelihood icons are noticed (Young 1994) and when used well when can aid communication. Howe- ver when used carelessly they can increase confusion (Horton 1994). The colours used in the icons during this focus group are white/grey, green, blue, amber/yellow and red as seen in Table 2. Participants made many comments about how they interpret the meaning of colours. They referred to the use of colour in in other contexts such as traffic lights.
These meanings of colours stated by the participants was, what they con- sidered, a conventional interpretation. This aligns closely with the meaning attributed to colour in ISO 2575. (ISO 2010) The use of colours not meeting their expectation were deemed confusing by the participants. It is interesting to compare the opinions of the focus group and the ISO standards with that of authors who have written recommendations for the use of colour in icon design from an IT perspective (Horton 1994) and from a Human Factors perspective (Green 1993). Table 2 shows a summary of the colours and mea- nings from the focus group participants, ISO 2575 and those of the authors of recommendations. From this table it is clear that standard colour use is consistent with the interpretations of the focus group.
CONCLUSION
The participants across the focus groups came to very similar conclusions about icons in MaaS. They felt consistency was important, for example City- mapper has several different icons for buses depending on the screen being viewed, it was felt this added unnecessary complexity.
Due to limited size available for an icon simple images were preferred and where possible accompanied by a text label. Intricate images were more difficult to identify at such a small scale. As MaaS apps are so sophisti- cated with multiple functions and screens if text labels are not suitable it should be possible to include a key (possibly in the FAQs) explaining their meaning.
There were many discussions related to colour in all groups. Even when no meaning was intended by the developer the colours of the icons were almost always considered significant. Particularly the use of red where it was frequ- ently interpreted this meant that there were problems with those services such as delays or cancellations This is because we are taught about the language of colours from a young age and in many contexts.
The following shows how the focus groups interpreted colours com- pared to existing conventions such as in a vehicle and icon design convention
Design Recommendations
Keep icons consistent across different screens or elements The Plan, Book, Pay, Navigate model of MaaS apps necessitates diffe- rent screens with different functions but keeping the same icons across the platform will increase learnability and decrease cognitive load.
Keeps icons simple in order to make them clear on a small screen The available real estate of a mobile phone screen is very limited, less complicated icons are easier to see increasing accessibility to those with vision difficulties.
Have a text label if space or the design allows A label explaining the more complicated or newer concepts will decre- ase ambiguity and confusion reducing the need for prior learning.
Ensure text labels are meaningful to the public Using industry language or jargon may not be understood by the wider public or many have a different meaning in common usage.
Include a key As MaaS apps are so complex having a key, as would be the norm on a physical map, can be helpful to new users. To save space this could be accessible in the help or FAQ menu.
Consider the use of colour carefully. Does it add value? Does the chosen colour have another meaning from that intended.
Users will assume the use of colour has meaning, even if this is not intended. When choosing colours check if they have any meanings in previous design literature. Try to avoid red especially unless using it to show a warning or alert.
ACKNOWLEDGEMENT
This study was funded by the UK Department for Transport as part of the Solent Future Transport Zone programme.
The Iconography of Mobility as a Service (MaaS) - A Focus Group Study 637
REFERENCES
Axon Active (2022) https://www.axonactive.com/portfolio/smart-mobility/sojo-tra vel (Accessed 30th May 2022). Baber, C. & Wankling, J. (1992) An Experimental Comparison of Text and Symbols
for In-Car Reconfigurable Displays, Applied Ergonomics, Vol 23 Issue 4 August 1992. Carney, C. Campell, J.L. & Mitchell, E. A. (1998) In-Vehicle Display Icons and Other Information Elements: Literature Review, U.S. Department of Transportation. Chong, M., Clauer, Y. & Green, P. (1990) Development of Candidate Symbols
of Automobile Functions Report UMTRI-90-25 The University of Michigan Transportation Research Institute. Citymapper (2022) https://citymapper.com/ (Accessed 30th May 2022). Cooper, L. & Baber. C. (2004) Focus Groups in Handbook of Human Factors and Ergonomics Methods, Neville Anthony Stanton, Alan Hedge, Karel Brookhuis, Eduardo Salas, Hal W. Hendrick (eds) CRC Press. Green, P. (1993) Design and Evaluation of Symbols for Automobile Controls and
Displays in Automotive Ergonomics Peacock, B. & Karwowski, W. (eds) 1993 Taylor & Francis. Horton, W. (1994) The Icon Book, John Wiley & Sons Inc. ISO (2010) ISO 2575:2010 Road vehicles - Symbols for controls, indicators and tell-tales. Krueger. R. A. & Casey. M. A., (2015) Focus Groups: A Practical Guide for Applied
Research Sage Publications. Longman, S. and Hillcoat, C. (2022) Developing the UK’s first multi-city MaaS platform. Intelligent Transport, 6, 1. Morgan, D. L., (1997) Planning Focus Groups Sage Publications. Morgan, D. L. (1997) Focus Groups as Qualitative Research (2nd ed) Sage Publica-
tions. Moser, S. (1998) Ancestral Images: The Iconography of Human Origins, Sutton Publishing Limited. Priest, H. A., Wilson, K. A. & Salas, E. (2006) National Standardization Efforts
in Ergonomics and Human Factors in Handbook of Standards and Guidelines in Ergonomics and Human Factors, Karwowski, W. (ed) Lawrence Erlbaum Associates. Revell, K. Richardson, J. Langdon, P. Bradley, M. Politis, I. Thompson, S. Skyrchuk, L.
O’Donoghue, J. Mouzakitis, A. & Stanton, N. (2019) That was scary…”exploring driver autonomous vehicle interaction using the Perceptual Cycle Model Contem- porary Ergonomics and Human Factors 2018 Charles, R & Wilkinson, J. (Eds) CIEHF. Richardson, J., Revell, K. M. A., Kim, J. & Stanton N. A. (2021) The iconography of vehicle automation—a focus group study Human-Intelligent Systems Integration 3(4).
LISTED IN THE AHFE DIGITAL BOOKSTORE CATALOGUE
Explore the complete digital volume
Intelligent Human Systems Integration (IHSI 2023): Integrating People and Intelligent Systems
Read this individual research paper free through the original publisher, or explore the full digital proceedings book.
ISBN 978-1-958651-45-2
Explore this ISBN in the AHFE Bookstore ↗Listed in the July 2026 bookstore catalogue; search by ISBN to confirm current availability · Digital book purchase optional