Maher Alsamsam, Paul Fink, Justin Brown, Velin Dimitrov, Nicholas Giudice (2023). Does it Press? Investigating the Efficacy of an Ultrasonic Haptic Button Interface for Non-Visual Driving Applications. In: Human Factors in Transportation. AHFE Open Access, vol. 95, pp. 343–353. https://doi.org/10.54941/ahfe1003819
Ultrasonic haptic (UH) feedback employs mid-air ultrasound waves detectable by the palm of the hand. This interface demonstrates a novel opportunity to utilize non-visual input and output (I/O) functionalities in interactive applications, such as vehicle controls that allow the user to keep their eyes on the road. However, more work is needed to evaluate the useability of such an interface. In this study, 16 blindfolded participants completed tasks involving finding and counting UH buttons, associating buttons with audio cues, learning spatial arrangements, and determining button states. Results showed that users were generally successful with 2–4 arranged buttons and could associate them with audio cues with an average accuracy of 77.1%. Participants were also able to comprehend button spatial arrangements with 77.8% accuracy and engage in reconstruction tasks to prove user understanding. These results signify the capability of UH feedback to have real-world I/O functionality and serve to guide future exploration in this area.
Ultrasonic haptic (UH) feedback is a novel method of haptic interaction with a multitude of potential applications. This method differs from other forms of haptic feedback in that it forms mid-air standing waves utilizing ultrasound, allowing for the perception of sensations without the need for direct touch or visual stimuli (Lehser et al., 2018). The ultrasound waves are emitted from an array of transducers and the wavefront converges to form a haptic focal point and this focal point stimulates mechanoreceptors in the skin, allowing for mid-air haptic perception (Hayward, 2015). Focal points can be used to draw shapes and patterns, and focal point properties such as speed and inten- sity can be altered to provide increased versatility (Rutten et al., 2020). The palm of the hand, being dense in Lamellar corpuscle mechanoreceptors, is a convenient location for interaction with UH feedback due to its high sensi- tivity to ultrasound waves, large surface area, and ready means of control
by the user (Rakkolainen et al., 2019). Since direct touch and visual sti- muli are not required, this alternative UI creates opportunities to increase inclusion using novel multisensory approaches. As such, this study aims to explore the capability of non-visual interactions to stand in for traditional visual interactions through the use of a UH interface.
UH feedback offers a UI that combines opportunities for both gesture con- trols (input) and haptic feedback (output). This technology can be beneficial for implementation in vehicles, where studies have shown that distracted driving, including adjusting in-vehicle controls, is a common cause of car accidents (McEvoy et al., 2006). Touchscreens and other visual displays are a particularly notable cause of car accidents due to their requirement for visual attention, leading to more incidents of distracted driving (Zulkefli et al. 2022). One approach to solving this problem involves the use of non-visual gestural interactions. Research has shown that gesture controls for vehicle navigation is a viable option and is an accepted navigation solution by users (Qian et al., 2020). A study conducted by Parada-Loira et al. 2014 found that for in-vehicle controls, although participants found touchscreen interactions to be easier, gesture controls were less distracting and more useful. Another solution to decrease distracted driving involved the implementation of haptic feedback with in-vehicle controls. Richter et al. 2010 integrated haptic feed- back with touchscreens, finding a decrease in error rates with input tasks. By combining gesture controls and haptic feedback, the best of both worlds— gestures as a preferred navigation method and haptic feedback to improve task performance and user experience—can be achieved to ultimately reduce distraction times (Gaffary & Lécuyer, 2018). To this end, the current study explores UH buttons, assessing the feasibility of their use in a non-visual UI with an input and output (I/O) mechanism. To investigate this applica- tion, this paper reports findings from an experiment in which participants identified and activated UH buttons that were associated with auditory cues. The experiment also examined participants’ ability to comprehend the spatial arrangement of buttons in a grid, including their state (active or inactive), and to represent this information in an accurate mental model. The goal of this study was to gain valuable insight into the effectiveness of real-world applica- tions of UH feedback to inform future implementations, such as utilization in vehicles. In doing so, the following research questions were explored: RQ1) Can UH buttons be located in an array without visual stimuli? RQ2) Can UH buttons be associated with multiple sound cues? RQ3) Can the location of UH buttons in an array be spatially visualized?
RELATED WORK
Existing research in this field generally pertains to studying the parameters that allow individuals to best haptically perceive ultrasound waves, as dif- ferent modulations can impact ultrasound wave perception. With regard to amplitude modulation, research shows that UH waves modulated at 40 kHz (Howard et al., 2019) are best perceived at a frequency between 150–200 Hz (Rümelin et al., 2017). It has also been found that with regard to spatial temporal modulation, an optimal focal point speed is 5 m/s to 10 m/s (Frier
Does it Press? Investigating the Efficacy of an Ultrasonic Haptic Button Interface 345
et al., 2018). In terms of distance, researchers have found that UH sensations are best perceived at 20 cm above the array (Rakkolainen et al., 2019). The projection of UH shapes has also been researched. One study measured par- ticipants’ ability to perceive circular patterns of different diameters, finding that perceived intensity positively correlates with circle size, with circles of 6 cm diameter being better perceived than 4 cm (Freeman & Wilson, 2021). However, it has also been shown that it is difficult for users to distinguish between different UH shapes (e.g., circle vs. square) (Rutten et al., 2019). To improve such distinction, Hajas et al. 2020 found that dynamic shapes (e.g., oscillating ultrasound amplitude) allowed for enhanced shape recognition compared to static shapes. Parameters for this current study were influenced by such research, along with in-lab pilot testing; these included using a mini- mum intensity of 140 Hz and a maximum of 200 Hz, a focal point speed of 7 m/s, and all the buttons being square shaped with a perimeter of 15 cm (inscribed within a circle of 5.3 cm diameter).
Several studies have investigated the utilization of ultrasound waves in veh- icles. Harrington and colleagues investigated participants’ ability to interact with UH buttons and UH slider bars in vehicles (Harrington et al., 2018). This study compared driving performances while using a touchscreen vs. gestures, finding that the addition of ultrasound haptics to gestures reduced visual demand and interaction times, and increased accuracy for the slider bar only. Shakeri et al. 2018 conducted a study assessing how various unimodal and multimodal feedback types (e.g., UH, visual, auditory) with in-vehicle controls affected driving performance. It was found that unimodal ultrasound feedback for hand gestures was beneficial to participants, but when combi- ned with other types of feedback it decreased performance. The current study evaluates not only the efficacy of UH buttons in an I/O interface, but also the capability of participants to create a mental model using this haptic interface that supports subsequent non-visual use scenarios.
METHODS
Participants 16 participants were recruited for this study, each completing both expe- riments. 11 participants identified as male (mean age 21.9 ± 4.01) and 5 identified as female (mean age 21.6 ± 1.51). 15 participants were right- handed, and none self-reported sensation loss in their dominant hand, which was used during the study. Prior to beginning the experiment, participants signed an informed consent form and completed a demographic survey. The study was approved by the Institutional Review Board at The University of Maine.
Setup The device used in this study was Ultraleap’s STRATOS Explore (https://www.leapmotion.com). This device features 256 transducers, emit- ting ultrasound waves modulated at a frequency of 40 kHz, in a 16 x 16 array with dimensions of 242 mm x 207 mm. An Ultraleap Leap Motion Controller
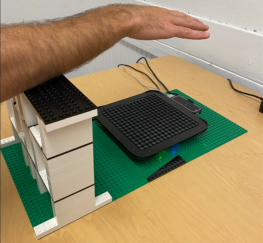
Figure 1: Photo of the ultraleap STRATOS explore device on the LEGO® structure.
was attached to the STRATOS Explore device to allow for hand tracking. Programming of the device and user interface was done using the Unity Technologies development environment, San Francisco, CA. The STRATOS Explore device was placed on a custom-built LEGO® platform, which consi- sted of a wall in front of the device, as shown in Figure 1. The wall was 16.5 cm high, allowing participants to rest their forearm on it to mitigate fatigue as well as guide the user’s hand during the experiments.
EXPERIMENT 1: UH BUTTON AUDIO CUES The purpose of this experiment was to assess a participant’s ability to interact with buttons through UH feedback and to associate different buttons with their unique outputs (auditory cues). Each participant completed three trials (each with a different number of buttons and button arrangement), consi- sting of two tasks per trial. Performance was compared as a function of the number of buttons and their arrangement in an array. The 4 auditory cues in this experiment were all related to vehicle sounds and were given one-word descriptions: engine (e.g., car engine starting), honk (e.g., car honking), lock (e.g., car door locking from the inside), and music (e.g., car stereo playing music). These stimuli were chosen in consideration of future applications of UH interactions in vehicles.
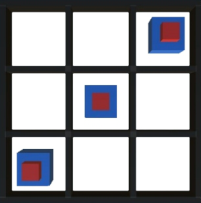
Procedure In this condition, buttons with a perimeter of 15 cm were randomly dispersed in a 3 × 3 grid above the STRATOS Explore device. The participants wore a blindfold and headphones, which played audio cues and masked noise from the device. Each button began in an inactivated state, where the intensity was 140 Hz, which was triggered when the hand hovered 20–30 cm above the array over a button. While in this range, pressing down 3 cm activated the button, temporarily increasing the intensity to 200 Hz and playing an audio cue (engine, honk, lock, or music). When the hand was removed, the button returned to the inactivated state. The button arrangements for this experiment are depicted in Figure 2. Participants completed each trial and its two tasks one at a time.
Does it Press? Investigating the Efficacy of an Ultrasonic Haptic Button Interface 347
Figure 2: Button arrangements in experiment 1 for trials 1–3 from left to right, respectively.
For the first task in each trial, the participant’s objective was to find each UH button and to state the one-word description of the associated audio cue. They were told to complete the task as fast as possible without sacrificing accuracy. This task evaluated whether participants were able to successfully interact with UH buttons and utilize the interface using an I/O mechanism. To help keep the participant’s hand within the active UH exploration stage, a beeping sound was played when their hand exited the outer bounds of the grid or moved below the buttons. The participants were not told the number of buttons in a trial, only that there would be one to four buttons. They confirmed verbally when they believed they had found all of the but- tons. A Qualtrics survey, completed by the researcher, was used to record the experimental data.
In the first task, if the participant did not initially identify each button in the trial, they were given up to two additional attempts, with up to two minutes per attempt, to do so. This ensured that participants were familiar with all the buttons in the trial in order for them to properly complete the second task. When the participant identified all the buttons, they moved on to the second task; if they were unable to do so, they moved on to the next trial. All participants were able to identify each button within the three total given attempts.
For the second task in each trial, the participant’s objective was to press each button once again and to say the associated sound cue as they pressed the button. This acted as a learning task, assessing if participants were able to accurately represent the UH button arrangement in memory and associate each button with its audio cue. The auditory cue was not played when the button was pressed for this task, and the participants were not told if they were correct. They were given only one chance to press each button. The researcher recorded the participant’s answers and the total time spent.
Results: Task 1 (Searching Task With Audio Cues) A repeated measures ANOVA compared the effect of the number of buttons in the trial on the time taken to find all the buttons in the first task. Results showed that there was a significant difference between the mean time taken to complete each trial (F(2, 14) = 10.066, p = 0.002). A 95% confidence interval was used for this test. The mean time for Trial 1 (three buttons) was
111.4 ± 46 seconds, for Trial 2 (two buttons) was 68.0 ± 37 seconds, and for Trial 3 (four buttons) was 49.7 ± 32 seconds. The observed grand mean was 76.4 seconds.
Next, the participant’s ability to find all the buttons for each trial in the first task was analyzed. In Trial 1, 12 participants (75.0%) found all the buttons on their first attempt, while the remaining 4 participants (25.0%) required 1 additional attempt to find all the buttons, with a mean time of 20.4 ± 40 seconds for the additional attempt. In Trial 2, all 16 participants (100%) found all the buttons on their first attempt. Finally, in Trial 3, 13 participants (81.3%) found all the buttons on their first attempt, and the remaining 3 participants (18.8%) required 1 additional attempt, with a mean time of 10.0 ± 24 seconds for the additional attempt.
Results: Task 2 (Association Task) A repeated measures ANOVA compared the effect of the number of buttons in the trial on the time taken to find all the buttons in the second task. Fin- dings showed a statistically significant difference in the mean time taken to complete each trial (F(2, 14) = 12.771, p < 0.001). A 95% confidence inte- rval was used for this test. The mean time for Trial 1 was 33.0 ± 18 seconds, for Trial 2 was 14.0 ± 7 seconds, and for Trial 3 was 25.0 ± 12 seconds. The observed grand mean was 24.0 seconds.
The participant’s ability to correctly identify each button without sound cues was analyzed for the second task. Across all trials, participants on ave- rage were able to correctly associate a button with its audio cue 77.1% of the time. In Trials 1 and 2, 14 participants (87.5%) correctly matched each but- ton to the appropriate sound cue. In Trial 3, 9 participants (56.3%) correctly matched the buttons with the appropriate sound cues.
Discussion
Participants were able to identify all the buttons in each trial faster as the trials progressed, with a statistically significant difference in the mean time for each trial, despite the third trial having the most buttons (four). This indi- cates that the number of buttons presented does not necessarily correspond with the time taken to identify the buttons, but rather the presence of a pos- sible learning effect. As the trials progressed, participants may have become more accustomed to the UH sensations and the bounds of the device, and therefore would have been more prepared in knowing what to expect and how to approach finding the buttons. The fact that the majority of partici- pants correctly associated buttons with audio cues, with an average accuracy of 77.1% for all trials, supports the notion that participants were able to comprehend button arrangements and associate inputs with outputs. One finding that does not fully align with the aforementioned trends is that the mean time for the association task of Trial 3 is greater than that of the associ- ation task in Trial 2, which was not necessarily expected given the decreasing mean searching task times. This does, however, correspond with the decrea- sed performance in the accuracy of the association task of Trial 3 compared to Trials 1 and 2, indicating that memorizing the output associations with
Does it Press? Investigating the Efficacy of an Ultrasonic Haptic Button Interface 349
four buttons may have been more cognitively challenging. Overall, results from this experiment show that participants were generally able to locate UH buttons while blindfolded (RQ1), and could associate inputs of the but- tons with auditory outputs (RQ2). This demonstrates participants’ capability to utilize a non-visual UH interface without extensive difficulty, suggesting that it could be a viable alternative to traditional visual interfaces or for use in eyes-free driving scenarios. Further research extending the current results could explore implementing UH buttons with different types of outputs or testing this UI with real-world driving applications.
EXPERIMENT 2: UH BUTTON STATE AND SPATIAL ARRANGEMENT The purpose of this experiment was to determine whether participants were able to differentiate between an activated vs. inactivated UH button. This would be applicable in systems where buttons can be in either an on or off state, as opposed to the mechanism in Experiment 1 where the button always resets to its original state. By including a second task in which participants drew the previously learned button arrangement and identified the activated button, we were able to assess their ability to accurately represent this con- figuration in memory. A recreation task evaluating whether the participants were able to form an accurate mental model of the spatial arrangements pro- vides more information than timing data alone, which is important when considering the design of a non-visual system.
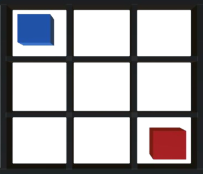
Procedure As was implemented in the first experiment, buttons with perimeters of 15 cm were randomly dispersed in a 3 × 3 grid 20 cm above the STRATOS Explore device. Participants wore a blindfold and headphones; the headph- ones masked noise from the device and played the same audio cues when the hand exited the outer and lower bounds of the grid (but no other audio cues were provided). There were 3 button arrangements (shown in Figure 3) unique to the trials from Experiment 1. Participants completed both tasks on each button arrangement for a total of three trials. They were told that there were one to four UH buttons in each trial and that one button was permanently in the activated state while the rest were in the permanently ina- ctivated state. Task 1 involved exploring the array to find each button and determining which button was activated, and verbally confirming when they believed to have found all the buttons. For Task 2, participants removed the blindfold (the display was occluded) and drew the button arrangement on a
Figure 3: Button arrangements in experiment 2 for trials 1–3 from left to right, respectively. 1 button in each trial is activated (indicated by red color).
sheet of paper in a 3 × 3 grid designed to mirror the array. They were requ- ested to indicate both the button locations and their state in the recreation. Participants were told that they were timed on how long it takes to find all the buttons and that they should perform the searching task as fast as possible without sacrificing accuracy.
Results: Task 1 (Searching Task With Button States) A repeated measures ANOVA compared the effect of the trial, or number of buttons, on the time taken to find all of the buttons. Results from this omnibus test revealed no significant differences in the mean time taken to complete each trial (F(2, 14) = 0.048, p = 0.954). A 95% confidence inte- rval was used for this test. The mean time for Trial 1 (two buttons) was 69.2 ± 40 seconds, for Trial 2 (four buttons) was 67.9 ± 44 seconds, and for Trial 3 (three buttons) was 69.3 ± 51 seconds. The observed grand mean was 68.8 seconds.
Results: Task 2 (Recreation Task) For the recreation task, the first measure analyzed was the number of parti- cipants who correctly recreated the spatial arrangement. A correct response included an accurate drawing of two components: the location of the button (e.g., in the correct grid square) and the button state (e.g., identified as acti- vated vs. inactivated). The number of participants who correctly drew the spatial arrangement and button states was 7 (43.8%) for Trial 1 (two but- tons), 8 (50.0%) for Trial 2 (four buttons), and 9 (56.3%) for Trial 3 (three buttons).
There were a total of nine buttons across every trial in this experiment. Despite the average correct recreations for each trial being around 50%, the average number of buttons correctly recreated (correct location and state) when removing the requirement of the correct overall arrangement, was 7.0 ± 1.8 for all trials, or 77.8% of buttons. Participant performance when observing accuracy for only the activated button and only button location (for participants with incorrect overall recreations) are outlined in Table 1.
Table 1. Summary of participant performance in each trial.
Table available in the original PDF paper.
Trial Activated button only Button location (of incorrect overall recreations) 1 12 participants correct (75%) 8/9 participants located 1 of 2 buttons; 1/9 located both but added erroneous 3rd button 2 13 participants correct (81.3%)
7/8 participants located 2 of 4 buttons; 1/8 located 3 of 4 buttons 3 13 participants correct (81.3%)
2/7 participants located 1 of 3 buttons; 4/7 located 2 of 3 buttons; 1/7 located all but added erroneous 4th Lastly, patterns were observed for drawings with incorrect button locati- ons. This was done by assigning a numerical value to the number of squares away from the actual position that a button was drawn, termed “degrees of error.” A value of 1 degree of error was given for each column and row that a button was drawn in error from its actual/correct position, where a correct location would have a value of 0 (e.g., for an actual button location at the
Does it Press? Investigating the Efficacy of an Ultrasonic Haptic Button Interface 351
bottom-left, an incorrect drawing of the button in the upper-right would have 4 degrees of error, which is the maximum in a 3 × 3 grid). Participants who missed a button or added an extra one, as noted above, were not included in this analysis. For Trial 1, the mean degrees of error was 1.0, with all 7 parti- cipants who had an incorrect drawing scoring 1 degree of error. For Trial 2, the mean degrees of error was 2.6; 5 participants scored 2 degrees of error (all were two buttons each with 1 degree of error), and 2 participants scored 4 degrees of error (one button with 1 degree of error and one button with 3 degrees of error). For Trial 3, the mean degrees of error was 1.3; 4 partici- pants scored 1 degree of error, and 2 participants scored 2 degrees of error (two buttons each with 1 degree of error).
DISCUSSION
Experiment 2 results showed that there was no significant difference in the mean time between each trial, meaning that trial completion durati- ons were similar between participants, regardless of the number of buttons. Participants may have spent more time attempting to visualize the spatial arrangement knowing they had to draw the button locations.
When considering performance on drawing the spatial arrangements and button states, it initially seems like participants did poorly with an average of only half of the participants correctly drawing each arrangement across the trials. However, a more nuanced interpretation looking at the performance of individual buttons shows that participants on average correctly located and identified the state of buttons 77.8% of the time. This finding sugge- sts that most mistakes were made with one or two buttons as opposed to a completely incorrect drawing. This is further evident when looking at the degrees of error for each trial: the majority of the incorrectly drawn but- tons were only off by 1 degree of error. These results demonstrate that while participants may not be able to accurately imagine and mentally represent the global spatial configuration of the buttons, they are generally able to learn and recall discrete aspects of the grid (RQ3). This suggests potential for successful integration of the UI, however, it may require an extended learning phase to achieve proficiency in both utilizing and conceptualizing the inter- face, as evidenced by the trend for a learning effect in these data from both experiments. The goal of these results is to guide the design of future work with UH feedback, specifically with regard to the implementation of input and output mechanisms. This includes creating an optimal interface for user experience and enabling effective mental representations that are necessary to support subsequent behaviors. These considerations are essential for the integration of a new UI such as UH feedback since the general population is used to traditional visual haptic feedback mechanisms, therefore, the transi- tion to a non-visual mechanism as displayed should be made as seamless as possible.
CONCLUSION
This paper reported findings from two experiments assessing the efficacy of UH buttons in a non-visual I/O interface. This is a promising interface for mid-air haptic interactions, offering opportunities for inclusivity and
improved UI experiences. The purpose of this study was to examine the useability of such an interface in order to assess if it is a practical solution to potentially replace current visual haptic feedback mechanisms. Overall, results show that participants were successfully able to locate and identify UH buttons with audio cues, differentiate between activated and inactivated UH button states, and create a mental model of UH buttons in an array—all without visual stimuli. This study opens avenues to further explore UH inter- faces with I/O functions, specifically with the implementation of UH buttons. It also demonstrates the inclusivity of the interface with its ability to be ope- rated without the need for visual stimuli, which is a positive indication for future applications in vehicles.
ACKNOWLEDGMENT
This study was supported by the VEMI Lab staff and students at The Univer- sity of Maine. Toyota Research Institute provided funds to support this work, which was also supported by NSF grant CHS-1910603 to N.A. Giudice.
REFERENCES
Freeman, E., & Wilson, G. (2021). Perception of Ultrasound Haptic Focal Point Motion. ICMI 2021 - Proceedings of the 2021 International Conference on Multimodal Interaction, 697–701. Frier, W., Ablart, D., Chilles, J., Long, B., Giordano, M., Obrist, M., & Subramanian,
S. (2018). Using Spatiotemporal Modulation to Draw Tactile Patterns in Mid-Air. In Haptics: Science, Technology, and Applications (pp. 270–281). Gaffary, Y., & Lécuyer, A. (2018). The Use of Haptic and Tactile Information in the Car to Improve Driving Safety: A Review of Current Technologies. Frontiers in ICT, 5(5). Hajas, D., Pittera, D., Nasce, A., Georgiou, O., & Obrist, M. (2020). Mid-Air
Haptic Rendering of 2D Geometric Shapes with a Dynamic Tactile Pointer. IEEE Transactions on Haptics, 13(4), 806–817. Harrington, K., Large, D. R., Burnett, G., & Georgiou, O. (2018). Exploring the use of mid-air ultrasonic feedback to enhance automotive user interfaces. Proce- edings - 10th International ACM Conference on Automotive User Interfaces and Interactive Vehicular Applications, AutomotiveUI 2018, 11–20. Hayward, V. (2015). Tactile illusions. Scholarpedia, 10(3), 8245. Howard, T., Gallagher, G., Lécuyer, A., Pacchierotti, C., & Marchal, M. (2019).
Investigating the Recognition of Local Shapes Using Mid-air Ultrasound Haptics. 2019 IEEE World Haptics Conference, WHC 2019, 503–508. Lehser, C., Wagner, E., & Strauss, D. J. (2018). Somatosensory Evoked Responses Elicited by Haptic Sensations in Midair. IEEE Transactions on Neural Systems and Rehabilitation Engineering, 26(10), 2070–2077. McEvoy, S. P., Stevenson, M. R., & Woodward, M. (2006). The impact of driver
distraction on road safety: Results from a representative survey in two Australian states. In Injury Prevention (Vol. 12, Issue 4, pp. 242–247). Parada-Loira, F., Gonzalez-Agulla, E., & Alba-Castro, J. L. (2014). Hand gestures to control infotainment equipment in cars. IEEE Intelligent Vehicles Symposium, Proceedings, 1–6.
Does it Press? Investigating the Efficacy of an Ultrasonic Haptic Button Interface 353
Qian, X., Ju, W., & Sirkin, D. M. (2020). Aladdin’s magic carpet: Navigation by inair static hand gesture in autonomous vehicles. International Journal of Human- Computer Interaction, 36(20), 1912–1927. Rakkolainen, I., Sand, A., & Raisamo, R. (2019). A Survey of Mid-Air Ultra-
sonic Tactile Feedback. Proceedings - 2019 IEEE International Symposium on Multimedia, ISM 2019, 94–98. Richter, H., Ecker, R., Deisler, C., & Butz, A. (2010). HapTouch and the 2+1 State Model: Potentials of Haptic Feedback on Touch Based In-Vehicle Information Systems. Proceedings of the 2nd International Conference on Automotive User Interfaces and Interactive Vehicular Applications - AutomotiveUI’10, 72. Rümelin, S., Gabler, T., & Bellenbaum, J. (2017). Clicks are in the air: How
to support the interaction with floating objects through ultrasonic feedback. AutomotiveUI 2017 - 9th International ACM Conference on Automotive User Interfaces and Interactive Vehicular Applications, Proceedings, 103–108. Rutten, I., Frier, W., & Geerts, D. (2020). Discriminating between intensities and velocities of mid-air haptic patterns. Lecture Notes in Computer Science (Inclu- ding Subseries Lecture Notes in Artificial Intelligence and Lecture Notes in Bioinformatics), 12272 LNCS, 78–86. Rutten, I., van den Bogaert, L., Frier, W., & Geerts, D. (2019, May 2). Invisible
touch: How identifiable are mid-air haptic shapes? Conference on Human Factors in Computing Systems - Proceedings. Shakeri, G., Williamson, J. H., & Brewster, S. (2018). May the force be with you: Ultrasound haptic feedback for mid-air gesture interaction in cars. Proce- edings - 10th International ACM Conference on Automotive User Interfaces and Interactive Vehicular Applications, AutomotiveUI 2018, 1–10. Zulkefli, M. T., Ahmad Shafiai, N. ‘Izzati, & Azizan, H. A. (2022, April 20). Auto-
motive Interior: A study on the Dashboard Touch Screen Panel and Its Impact to the Driver. Proceedings of the 2nd International Conference on Design Industries & Creative Culture, DESIGN DECODED 2021.
LISTED IN THE AHFE DIGITAL BOOKSTORE CATALOGUE
Explore the complete digital volume
Human Factors in Transportation
Read this individual research paper free through the original publisher, or explore the full digital proceedings book.
ISBN 978-1-958651-71-1
Explore this ISBN in the AHFE Bookstore ↗Listed in the July 2026 bookstore catalogue; search by ISBN to confirm current availability · Digital book purchase optional