Sabina Bähr, Fabian Edel (2023). The effect of colored light in the vehicle interior on the thermal comfort and thermal responses of vehicle occupants. In: Human Factors in Transportation. AHFE Open Access, vol. 95, pp. 71–81. https://doi.org/10.54941/ahfe1003793
Light and colors have an impact on the mood of car drivers through their emotional change. This result was shown in our last year AHFE-Publication (2022) “Enhanced driver’s experience through emotion sensitive lighting interaction”. The result is that light and color can change the driver’s emotions to the positive and negative. This effect can have lots of further automotive application fields, e. g. the change of the drivers thermal sensation. In case of the e-mobility, warming light and color (red end of the visible spectrum) can support the heating system to get thermal comfort to the driver and will reduce energy for heating and for that increase the electric range. The thermal comfort is very important factor for driving comfort. This work aims to investigate the subjective thermal perception and physiological responses of vehicle occupants through the influence of thermal and visual stimuli in the vehicle interior. To achieve the described goal, a methodological approach was developed. The steps of the methodological approach and the research structure are shown below:•Definition of the research questions; the main question is whether colored light can influence the subjective perception of warmth and the physiology of vehicle occupants through static and dynamic lighting•Obtaining a literature review on the main topics: “thermal comfort”, “lighting in the vehicle interior” and “the influence of colored light on thermal sensation”•Derivation of requirements for the vehicle test setup•Realization of the experimental setup•Conducting a subject study•Evaluation of the data.Study design: A 4 x 2 factorial within subject design is used to determine the influence of “colored light” and “temperature” on thermal, visual, and overall comfort. Of the four scenarios of the predictor variable colored light, three are static and one is dynamic. The static light colors are blue, white, and orange and the dynamic light scenario is a video with candlelight or a video with a winter landscape depending on the temperature level. The two selected temperature levels are 24.5 °C and 26.0 °C. These were regulated via a self-built climate chamber and checked via several sensors. Since the study was conducted in summer, the temperatures were selected to be within (24.5 °C) and outside the comfortable temperature range for the vehicle interior, based on the recommendation of the German automobile association ADAC. Outcome Variables: After experiencing each colored light in combination with temperature, participants answered questions about their thermal, visual, and overall comfort of the vehicle interior environment. To check whether the colored light influences the physiology of participants, heart rate and skin temperature were continuously recorded via a wristband. Sample: Twelve valid subjects (six females, six males) participated in the vehicle lighting study, recruited without financial incentives through the University of Stuttgart and Fraunhofer IAO departments. Procedure: The combination of the predictor variables "colored light" and “temperature” resulted in eight sessions, which were all experienced by the subjects and randomized across the sessions. At the beginning of the study, the subjects received initial instructions and put on the wristband so that the recording of physiological data could start. They then entered the vehicle, and a 13-minute acclimation period began, which served to acclimate the subject to the temperature and to achieve a similar level of activity among the participants. The vehicle was then illuminated with the first color (blue or orange) for 6.5 minutes, and participants were asked to answer questions about the first session after the first four minutes. After that, the light color changed to white for one minute, and then the vehicle was illuminated with the next color. After the first four sessions at the first temperature level, there was a 15-minute break, after which the next four sessions began at the second temperature level. In total, the study lasted approximately 2 hours per participant. Analysis: Is performed using parametric and nonparametric tests. In addition, the covariates age, gender, and BMI of the subject and the temperature difference of the actual to the target temperature were examined for the influence on the outcome variables. The results show that colored light affects thermal perception under different temperature levels. The indoor environment under the orange light was perceived as warmer than under the blue light. In addition, participants found the blue light more comfortable than the orange light in warm environments and they preferred a lower temperature with orange light compared to the blue light or the dynamic video of a winter landscape in warm environments. The use of colored light could therefore lead to energy saving in the e-mobility. The full paper and presentation will go into more detail about the methodology and the results.
In the last few years, there has been a strong change in the interior design of vehicles. This change will continue in the future, especially in case of autonomous driving. For an interior design, the satisfaction, well-being and acceptance of the user is extremely important and can be characterized by the factors visual comfort, thermal comfort, air quality and acoustics (World Health Organization 1990). To address the visual sensation light and color in the interior getting more and more important. From a technical point of view, there is the possibility of using a variety of different ambient lights and colors for individualization and personalization to satisfy customer needs and incre- ase sales. In the market, there is an increasing number of cars in the middle and upper class that already have ambient lighting installed (Caberletti et al. 2010). But not only new cars from the OEM’s have ambient lights, there are a lot of retrofit options on the market. Ambient lights with different lights and colors can support the car driver’s emotion. The last years publication “Enh- anced driver’s experience through emotion sensitive lighting interaction” at the AHFE 2022 showed, that light and color have an impact on the mood of car drivers by their emotional change. The result is, light and color can change the driver’s emotions to the positive and also negative (Braun et al. 2022). By using this effect, it could be possible to change the driver’s thermal
sensation by using light and color. Especially in case of the e-mobility, war- ming light and color can support the heating system to get thermal comfort to the driver and save energy. The usage of light and color can help to support the heating system in the car by giving the driver a good thermal comfort. In this case, the energy use of the system is reduced and that can increase the electric range (Flieger 2014). In addition, thermal comfort is a very important factor for driving comfort and can contribute to (mass) personalization and individualization (Frisch et al. 2013).
This work aims to investigate the subjective thermal perception and physi- ological responses of vehicle occupants through the influence of thermal and visual stimuli in the vehicle interior. While the thermal and visual perception are recorded in a proband study with the help of a questionnaire, the phy- siological reactions are continuously measured using skin temperature and heart rate.
In general, there is existing an approach, which describes the correlation to reduce thermal discomfort with colored light. The principal of this appro- ach is based on the Hue-Heat-Hypothesis (HHH). This hypothesis states, that colored light can change people’s thermal perception. For that, a colo- red environment at the red end of the visible spectrum is perceived as warm and a colored environment at the blue end of the visible spectrum as cold (Bennett and Rey 1972). With this hypothesis, an application to the auto- motive sectors is possible by using colored light at the interior to manage the user’s thermal sensation. This work should verify the hypothesis for the auto- motive sector because it is less researched. The conducted literature review shows that color and light have effects on the human thermal sensation and comfort (Huebner et al. 2016; Winzen et al. 2014; Chinazzo et al. 2021). However, the application, especially of visualizations, in vehicles for drivers has not been extensively researched.
The objective of this work and the literature review raise several research questions. The main question is: Does colored light in the vehicle interior influence the thermal sensation of vehicle occupants in terms of the Hue-Heat-Hypothesis?
Beside this main research question, there are more central questions to be answered, such as whether …
colored light in vehicle interior influences the physiology of the passengers, in case of heart rate and skin temperature,
the influence of colored light in the vehicle interior changes the subjective thermal sensation at different levels of temperature,
the influence of colored light in the vehicle interior changes the thermal comfort by dynamic lighting.
To answer this research questions, a technical Early-Prototype1 was build and an experimental subject study was carried out. The methodological approach for that is shown in the following chapter.
1An Early-Prototype is defined as an easy- and fast-to-build but incomplete type of a prototype as it focusses on those aspects that are necessary for a defined test. Unlike a commonly known prototype, an Early-Prototype only includes properties which are necessary to realize a prototype at an explicit moment for the development of new technologies and to reach the defined testing goals (Braun et al. 2022).
The Effect of Colored Light in the Vehicle Interior 73
METHOD
To achieve the described goal and answer the research questions, a methodo- logical approach was developed for this work. The first step was to define the research questions. Then, the state of the art in the fields of thermal comfort, psychological effects of light and color, lighting in vehicle interiors and the influence of colored light on thermal sensation was researched. This research defines the experimental setup of the subject study, which is done via a 2x4 factorial study design with the factors temperature and light color. This is followed by user testing, data analysis, and evaluation. Figure 1 shows the methodological approach of this work.
The research questions and the summary of the research work have already been mentioned in the previous chapter. Due to space limitations, it cannot be discussed in detail here. The focus of this paper is on the experimental setup, user testing and results. For the experimental setup, lighting scenarios have to be defined and for the investigation of the thermal comfort, the temperature needs to be controlled to a planned value and a consistent test environment.
Light Scenarios: The defined light scenarios have three different colors for the static scenarios and two dynamic light scenarios. The colors as well as the illuminance of the colors for the static scenarios are orange (RGB: 255/177/0, 200lx), white (255/255/255, 280lx) and blue (0/179/255, 150lx), which are based on the Hue-Heat-Hypothesis. The dynamic scenarios are candlelight (139/85/38, 114lx) and winter landscape (124/134/143, 104lx). To get the RGB-value for the dynamic scenarios, the average color value of the whole dynamic sequence was measured. By using these colors, the aim is to inve- stigate, if people have a colder thermal sensation by blue light and whether people have a warmer thermal sensation by using orange light, compared with white light, which is used as the reference color.
Temperature Levels: The light scenarios are combined with two tem- perature levels 24.5
C and 26
C (297.65 K and 299.15 K). The lower temperature level is within the comfortable temperature range for the vehi- cle interior and the higher level is outside the comfortable temperature range (Thomas Kroher 17.11.2020). Two temperature levels are important to get a variety of test sections with different temperatures to prevent wrong sub- jective thermal feelings. The light scenarios and the temperature level are the independent variables of this study.
Experimental Setup: For that an experimental setup was developed and build. The vehicle which is used for the user tests is a light electric vehicle (Renault Twizy). This vehicle has the advantage, that the driver, who is sit- ting in the middle of the vehicle, can be surrounded by visualizations and
Figure 1: Methodical approach.
74 Baehr and Edel
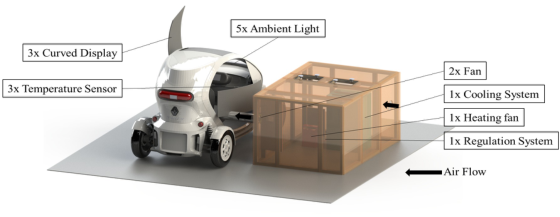
displays with the same distances. The Twizy’s Interior is nearly symmetrical, which helps to create a perfect light and color effect for the test persons. For the implementation of light and color output, and in addition showing dyna- mic visualizations, three curved displays are installed. One on each side at the door and one in the headlining. The displays are curved for a better fitting into the interior of the vehicle. To support the visual effects on the displays, five ambient lights are installed, which are connected to the display signal. To regulate the temperature inside the vehicle (for the test temperatures and to eliminate the waste heat from technical devices) three temperature sensors are built in. These sensors are connected with a several build climate cham- ber to analyze and adjust the interior temperature. The climate chamber has a heating fan to raise the temperature, a cooling system to lower the tem- perature and several fans to transport the air into the climate chamber and vehicle. In front of the vehicle, a big display and inside of the vehicle a sound system completing the experimental setup to present a driving scenario. The laboratory for conducting the study is an empty room with darkened win- dows, low light, and a monitoring station. Figure 2 shows the experimental setup of the vehicle and the climate chamber.
To get results about the thermal sensation of the test persons, in this study the psychological and physiological variables are measured with qualitative and quantitative methods. The qualitative method is a questionnaire to get the subjective perception of the test persons regarding their vehicle environ- ment. The questionnaire contains questions about the thermal and visual sensation at the vehicle environment, which are inspired by EN ISO 10551 and Chinazzo et al. (2021). The questions and the response scales with answer options are the following:
Thermal Perception (1) How do you feel exactly in this moment? (Thermal sensation) [From Cold: -3 to Hot +3] (2) How do you feel about the thermal environment? (Thermal comfort) [From Comfortable: 1 to Extremely uncomfortable: 5] (3) How would you rather feel now? (Thermal preference) [From Much cooler: -3 to Much warmer: +3]
Figure 2: Experimental setup for visualization and temperature control in the test vehicle.
The Effect of Colored Light in the Vehicle Interior 75
Visual Perception (4) The actual lightening is … (Brightness sensation) [From Extremely dark: 1 to Extremely bright: 7] (5) How pleasant do you find the brightness of the vehicle lighting? (Visual comfort) [From Pleasant: 1 to Extremely unpleasant: 5] (6) How do you perceive the lighting in the room? (Cold-Warm Association of Light) [From Cold: 1 to Warm: 5] (7) How do you perceive the light color in the vehicle interior? (Color acceptance) [From Pleasant: 1 to Extremely Unpleasant: 5]
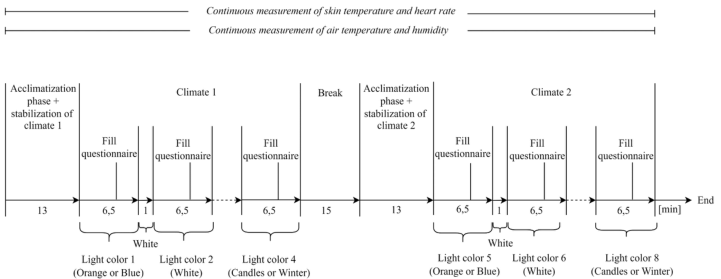
Figure 3: Procedure of the study (inspired by Chinazzo et al. (2021)).
The quantitative method is used to record changes in the body of the subje- cts in relation to the respective environment. Therefore, skin temperature and heart rate are measured with an Empatica E4 wristband, which the subjects must wear during the user test. These physiological variables are measured because they are suspected to be influenced by colored light, as shown in the literature review (te Kulve et al. 2016). With the technical experimental setup and questionnaire described above, the mentioned light scenarios can be executed. A study procedure is developed to have a structured, standardi- zed and comparable process. The procedure is a mix of acclimatization, test sections, questionnaire and short breaks. The overall time for the study is about 99 minutes. More details of the procedure are shown in Figure 3.
Participants A total of 15 adults (9 males and 6 females) with normal color vision parti- cipated in the study. Due to technical problems in stabilizing the temperature inside the vehicle, the data of 3 participants were excluded from the analy- sis. This resulted in the final sample size of 12 participants (6 males and 6 females). Table 1 describes the characteristics of the participants. Participants were required to wear a specific dress code during the study to ensure a similar level of clothing insulation. This consisted of a shirt, thin long pants, underwear, thin socks and closed shoes. In combination with the vehicle seat, this resulted in a thermal insulation of about 0.75 clo (EN ISO 9920). Participation in the study was not compensated. All participants went
76 Baehr and Edel
Table 1. Participants’ characteristics (n = 12).
Table available in the original PDF paper.
Mean ± Standard Deviation (SD) Age [years] 26.33 ± 7.43 Weight [kg] 70.33 ± 15.50 Height [m] 1.74 ± 0.09 BMI [kg/m2] 23.01 ± 3.83
through all light scenarios and both temperature levels and answered questi- ons about thermal and visual comfort of the vehicle interior environment at the end of each combined scenario.
Statistical Analysis: To analyze the subjective ratings and physiological responses, statistical tests were performed using IBM SPSS Statistics 26. Ini- tially, the data were tested for normality using the Shapiro-Wilk test, and parametric or nonparametric analysis was performed depending on the test result (Field 2017).
In the case of a parametric analysis, the effects of the lighting scenarios on the dependent variables were examined using a two-way ANOVA with repeated measures. An exception is made for the dynamic lighting scenarios, as they were only studied at one temperature level, so t-tests are performed for dependent samples. The effect of vehicle temperature on the dependent variable was also tested with a t-test for dependent samples due to their two manifestations. In the presence of a significant effect, a post-hoc test in the form of a pairwise comparison was also performed and the effect size η2part was determined.
In the case of nonparametric analysis, Wilcoxon tests and Friedman tests were performed. In the case of a statistically significant difference, post-hoc tests were also performed, and the effect size r was determined. Potential covariates were also included in the statistical analysis. These are the perso- nal factors age, BMI, and gender of the probands as well as the temperature variation 1TVehicle, which represents the difference between the target tem- perature and the measured temperature. The significance level α is set to α = 5% for all analyses.
RESULTS
The subchapter first describes the climatic conditions measured in the vehicle. Then, the results from the analysis of the subjective and physiological data are described. The results from the subjective data are divided into two areas: Thermal perception and visual perception. Finally, the covariates that may have an influence on the dependent variables are shown.
Thermal Vehicle Environment: The statistics for the mean, operative air temperature inside the vehicle for each combination of temperature level and lighting scenario are shown in Table 2. The measurements show that the mean room temperatures differ only slightly between the color exposu- res and that the variations are slightly higher at the lower temperature level
The Effect of Colored Light in the Vehicle Interior 77
Table 2. Mean values ± SD of the measured air temperature depending on the light scenario and temperature level (values in ◦C).
Table available in the original PDF paper.
Target air temperature
Blue White Orange Candlelight or winter landscape 24.5
C). As listed in the previ- ous, these temperature variations are accounted for as a covariate 1TVehicle. The relative humidity (RH) was between 20 % - 35 % RH. The air velocity was below the threshold value of 0.1 m/s.
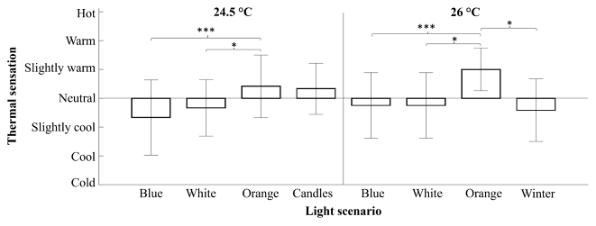
Thermal Perception: The subjective responses to the evaluation of the veh- icle thermal environment are shown in Figure 4 and Figure 5. The left side of the figures shows the results of the means and SDs of the dependent variables for 24.5
C, and the right side shows the results at 26
C. Significant effects are marked with “*” p < 0.05, “**” p < 0.01, “***” p < 0.001. It can be seen in the figures that under the same temperature, the thermal perception varied with the colors.
The effect of light colors on thermal sensation ratings can be seen in Figure 4. The statistical analyses show that significant differences exist betw- een the colored lights in the evaluation (F(2, 22) = 13.23, p = < 0.001). Pairwise comparisons lead to the conclusion that thermal sensation was rated significantly higher under the orange condition than under the blue condition and than under the white condition, regardless of temperature level. In addi- tion, the vehicle environment was perceived to be significantly cooler in the winter condition than in the orange condition (t = 3.03, p = 0.012, r = 0.67).
The colored light also influences thermal comfort, although only at the temperature level of 26
C. The light color white was perceived as more uncomfortable than all other light colors (χ2(3) = 12.84, p = 0.005).
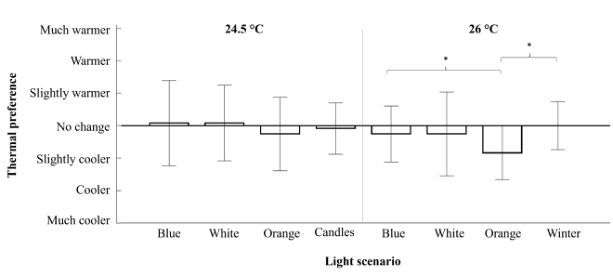
Preference to change temperature was significantly different between light exposures only at the higher temperature level (χ2(3) = 8.78, p = 0.032). The post-hoc analyses show significant differences between the blue and orange colors (z = −2.07, p = 0.038, r = 0.42) and between the orange and winter
Figure 4: Mean value and standard deviation of the thermal sensation rating for each temperature level and light scenario.
78 Baehr and Edel
Figure 5: Mean value and standard deviation of the thermal preference rating for each temperature level and light scenario.
light scenarios (z = −2.43, p = 0.015, r = 0.5). As can be seen in Figure 5, participants at the higher temperature level preferred a cooler environment for the orange exposure than for the “cool” light exposures. Statistical analy- ses of the effect of temperature on thermal perception show, contrary to expectation, that our temperature difference has no effect, except on ther- mal preference ratings. In this, the study participants preferred a significantly cooler environment at 26
C (z = −2.56, p = 0.01, r = 0.31).
Examining the covariates 1TVehicle, age and BMI on thermal perception, the results show that these had a significant influence. While 1TVehicle signi- ficantly influenced thermal sensation (at a temperature level of 24.5
C), probands’ age and BMI influenced thermal comfort and thermal preference scores. Younger probands found the thermal environment at 24.5
C less uncomfortable than older probands and probands with a higher BMI (> 24) preferred a cooler environment than probands with a lower BMI. Gender had no effect on thermal perception.
Visual Perception: The analysis of the effect of temperature and light sce- nario on visual perception is performed using non-parametric tests. The statistical analyses show that the temperature has no significant influence on the visual evaluation, but the lighting situation does. Here, the results show that the light color has an influence on the cold-warm association (χ2(3) = 19.53, p < 0.001 at 24.5
C and χ2(3) = 16.16, p = 0.001 at 26
C). The post-hoc analyses show that the light scenario orange was perceived as warmer than blue, confirming the cold-warm association of the colors. In addition, the candlelight scenario was perceived as a warmer light scenario than the blue and white scenario.
In addition, the white light scenario was perceived as significantly brighter than the other light scenarios (χ2(3) = 10.03, p = 0.018). This is also evident in the illuminance of the light colors. The high illuminance may have caused the white light color (M = 2.5, SD = 0.9) to be perceived as significantly more unpleasant than the winter scenario (M = 1.5, SD = 0.7) and than the blue light scenario (M = 1.6, SD = 0.7). For lighting comfort, light color did not prove to be a significant factor.
The Effect of Colored Light in the Vehicle Interior 79
Physiological Measurements: In the analysis of the physiological data, the heart rate and skin temperature data are evaluated. For heart rate, it is shown that it is neither influenced by the light scenarios (F(2, 20) = 0.83, p = 0.45) nor by the air temperature (F(1, 10) = 1.46, p = 0.26). Furthermore, no effect of the light scenarios on skin temperature was detected.
DISCUSSION
In the following, the influence of light scenarios and temperatures on thermal perception as well as on physiological responses is presented. The limitations of the study and the need for further research are then highlighted.
Effect of Colored Light and Temperature on Thermal Perception: It was observed from the results that the “warm” light scenarios (orange and cand- les) were perceived as warmer than the “cold” blue light scenario. These results confirm the HHH. In addition to the perception of a warmer envi- ronment under an orange light influence, the probands also desired a much cooler environment at the temperature level of 26
C than under the blue light influence and the winter scenario. The results agree with further litera- ture in which thermal perception was investigated after being influenced by artificial, colored light (Huebner et al. 2016; Lu et al. 2015; Winzen et al. 2014). Another finding from the results of this study is that the temperature difference of 1.5
C did not lead to any significant change in thermal sen- sation. It is therefore more interesting that the light scenarios were able to achieve this effect.
Effect of Colored Light and Temperature on Physiological Responses: No effect of light color and temperature on physiological responses was found. The lack of effect of light color on skin temperature and on heart rate agrees with other research findings by Fanger (1972), Lu et al. (2015) and Chinazzo et al. (2021). Since physiological values did not change between light scenarios, the authors assume that the influence of light color on thermal perception is only psychological.
Study Limitations and Further Research: The study was conducted in a self-developed experimental environment where one difficulty was to accura- tely control the air temperature in the interior of the small vehicle. In addition, the subjects in the experiment were exposed to a relatively narrow and high temperature level. Since the results show that the temperature change did not lead to any influence on the dependent variables in most evaluations, future studies should be conducted with larger temperature differences and lower temperature levels. Another limitation of the study was that the illuminance of the light colors was not exactly the same. Furthermore, the sample was quite small. In addition, with 75 % mainly younger people (under 30 years) participated in the study. Therefore, the results are not transferable to per- sons of other ages. Considering this, other age groups should be considered in future research.
The study took place in summer. As thermal and visual perception may also depend on the season, further studies should be conducted at different times of the year. It should also be mentioned that the vehicle occupants in this study did not have to perform any driving tasks. It is possible that the effect of
80 Baehr and Edel
the change in thermal perception caused by colored light is less strong when people take over the driving task. In addition, it must then be investigated whether the driving performance remains the same due to the color effect and what energy savings can be achieved.
CONCLUSION
The main goal of this study was to investigate whether colored light (static: blue, white, orange; dynamic: candlelight and winter landscape) in the vehi- cle interior at two different temperatures (24.5
C and 26
C) can influence the thermal perception of vehicle occupants. The results show that colored light affects thermal perception under different temperature conditions. The indoor environment under the orange light was perceived as warmer than under the blue light. In addition, participants found the blue light more comfortable than the orange light in warm environments and they prefer- red a lower temperature with orange light compared to the blue light or the dynamic video of a winter landscape in warm environments.
To sum up, results provide initial evidence that colored light in the veh- icle interior can influence the thermal perception of the vehicle occupants. However, whether colored light can actually be used as a tool to reduce energy consumption for heating and cooling the vehicle interior needs to be investigated in further studies during ongoing driving operations.
REFERENCES
Bennett, C. A./Rey, P. (1972). What’s so hot about red? Human Factors 14 (2), 149–154. https://doi.org/10.1177/001872087201400204. Braun, Franziska/Edel, Fabian/Ardilio, Antonio (2022). Enhancing driver’s experie-
nce through emotion sensitive lighting interaction. In: Usability and User Experi- ence, 13th Inter-national Conference on Applied Human Factors and Ergonomics (AHFE 2022), July 24-28, 2022. AHFE International. Caberletti, L./Elfmann, K./Kummel, M./Schierz, C. (2010). Influence of ambient lighting in a vehicle interior on the driver’s perceptions. Lighting Research & Technology 42 (3), 297–311. https://doi.org/10.1177/1477153510370554. Chinazzo, Giorgia/Chamilothori, Kynthia/Wienold, Jan/Andersen, Marilyne (2021).
Temperature-Color Interaction: Subjective Indoor Environmental Perception and Physiological Responses in Virtual Reality. Human Factors 63 (3), 474–502. https://doi.org/10.1177/0018720819892383. EN ISO 10551. Ergonomics of the physical environment — Subjective judgement scales for assessing physical environments (ISO 10551:2019). Berlin. EN ISO 9920. Ergonomics of the thermal environment - Estimation of thermal
insulation and water vapour resistance of a clothing ensemble (ISO 9920:2007, Corrected version 2008-11-01); German version EN ISO 9920:2009. Berlin. Fanger, P. O. (1972). Thermal comfort: Analysis and applications in environmental engineering. Applied Ergonomics 3 (3), 181. https://doi.org/10.1016/s0003- 6870(72)80074-7. Field, Andy (2017). Discovering Statistics Using IBM SPSS Statistics. London,
England, SAGE Publications. Flieger, Björn (2014). Innenraummodellierung einer Fahrzeugkabine in der Programmiersprache Modelica.
The Effect of Colored Light in the Vehicle Interior 81
Frisch, Arnulf/Schanda, Marco G./Engelhardt, Sabine/Geisel, Thomas/Lasi, Ulrich (2013). Wellness und Büro vereint. ATZextra 18 (5), 70–77. https://doi.org/10. 1365/s35778-013-0053-3. Huebner, G. M./Shipworth, D. T./Gauthier, S./Witzel, C./Raynham, P./Chan, W.
(2016). Saving energy with light? Experimental studies assessing the impact of colour temperature on thermal comfort. Energy Research & Social Science 15, 45–57. https://doi.org/10.1016/j.erss.2016.02.008. Lu, Shengnan/Ham, Jaap/Midden, Cees (2015). Persuasive Technology Based on Bodily Comfort Experiences: The Effect of Color Temperature of Room Lighting on User Motivation to Change Room Temperature. In: International Conference on Persuasive Technology. Springer, Cham, 83–94. te Kulve, M./Schellen, L./Schlangen, L. J. M./van Marken Lichtenbelt, W. D. (2016).
The influence of light on thermal responses. Acta physiologica (Oxford, England) 216 (2), 163–185. https://doi.org/10.1111/apha.12552. Thomas Kroher (2020). Klimaanlage richtig bedienen: Prima Klima das ganze Jahr. ADAC of 11/17/2020. Available online at https://www.adac.de/rund-ums-f ahrzeug/ausstattung-technik-zubehoer/ausstattung/klimaanlage-tipps/ (accessed 1/29/2023). Winzen, J./Albers, F./Marggraf-Micheel, C. (2014). The influence of coloured light in
the aircraft cabin on passenger thermal comfort. Lighting Research & Technology 46 (4), 465–475. https://doi.org/10.1177/1477153513484028. World Health Organization (1990). Indoor environment: health aspects of air quality, thermal environment, light and noise.
LISTED IN THE AHFE DIGITAL BOOKSTORE CATALOGUE
Explore the complete digital volume
Human Factors in Transportation
Read this individual research paper free through the original publisher, or explore the full digital proceedings book.
ISBN 978-1-958651-71-1
Explore this ISBN in the AHFE Bookstore ↗Listed in the July 2026 bookstore catalogue; search by ISBN to confirm current availability · Digital book purchase optional