Kimihiro Yamanaka (2023). Driver Attribute Classification Method Based on Driving Behavior. In: Application of Emerging Technologies. AHFE Open Access, vol. 115, pp. 460–466. https://doi.org/10.54941/ahfe1004344
In this study, the objective was to develop a method for classifying driver attributes based on driving behavior, aiming to create a driving support system that enhances safety and comfort. Unlike traditional methods that relied on check sheets for accurate but delayed attribute classification, this study focused on immediate and flexible classification. An experiment was conducted using a driving simulator to predict driver attributes through multiple regression analysis of the driving log, which recorded vehicle behavior during driving. The obtained results were then applied to facilitate a harmonious interaction between the driver and the system, particularly in environments involving automated driving levels 2 and 3, where the driver remains engaged in the driving operation.The summarized results of the study are as follows:1)A model was proposed to predict two driver attributes: driving safety aptitude and system dependence.2)The study confirmed a correlation between the two driver attributes and actions/behaviors associated with deceleration, as observed from the driving behavior parameters extracted from the driving logs.Specifically, individual driver characteristics were more likely to manifest in braking operations and deceleration-related driving behavior. The study suggests that incorporating additional parameters related to deceleration could further enhance the accuracy of driver attribute prediction.Overall, this research contributes to the development of a driver support system that considers driver attributes and behavior, enabling a safer and more comfortable driving environment, particularly in the context of automated driving.
In recent years, automobiles have become indispensable conveniences in soci- ety; however, they can also be dangerous, causing fatal accidents. To ensure safety within the automobile industry, various safety measures have been implemented in Japan since 2000. Mandates such as seatbelts, airbags, and anti-lock braking systems (ABS) (passive safety) have helped mitigate the damage caused by accidents. Furthermore, the proliferation of preventive safety features in recent years, such as collision avoidance braking (active safety), has led to a proactive reduction in the occurrence of traffic accidents. The effectiveness of these technological developments and regulatory efforts is evident in the trends observed in metrics such as the number of traffic accidents and casualties (Cabinet Office, 2019).
Currently, the development of autonomous vehicles is being pursued to fur- ther reduce traffic accidents and achieve smooth flow of traffic. According to the Government-Private ITS Concept and Roadmap 2019, autonomous driving is divided into five levels. In terms of practical implementation, autonomous driving falls within levels 2 and 3, where drivers are required to control the vehicle through steering and pedal operations, depending on the situation. In other words, individuals engage in driving operations as drivers,
Driver Attribute Classification Method Based on Driving Behavior 461
while the vehicle provides support, and a driver-centric automotive system is sought (Government CIO’s Portal, 2019).
Therefore, this study aims to provide a safer and more comfortable driving environment by allowing drivers to benefit from a driving assistance system without experiencing discomfort. This study’s goal is to develop a method for estimating driver attributes (safety, driving aptitude, and system dependency) considering practical implementation, using information that the vehicle can acquire. In addition, the effectiveness of this approach is examined.
DRIVER ATTRIBUTES AND CLASSIFICATION A “Driving Style Check Sheet” for subjectively evaluating individual differ- ences in daily driving behavior and a “Driving Workload Sensitivity Check Sheet” for understanding driver-specific characteristics related to driving assistance have been developed by Akamatsu et al. (2004). Although it lacks immediacy, this methodology can be considered a useful reference for individual driver traits. Additionally, a correlation has been demonstrated between the Driving Style Check Sheet and safety verification behaviors dur- ing driving (surroundings checked through head movements), suggesting that driver-specific traits assessed by the check sheets may manifest in driving operations.
Driver attributes (safe driving aptitude and system dependency) were clas- sified using driving behavior parameters, derived from driving logs obtained during driving simulator (DS) sessions.
Driving Style Check Sheet The Driving Style Check Sheet is a questionnaire comprising 18 questions regarding attitudes, inclinations, and thought processes during daily driv- ing. The responses are divided into four levels: “Does not apply,” “Slightly Applicable,” “Fairly Applicable,” and “Highly Applicable” (Akamatsu et al., 2004) (see Appendix I for the questionnaire). Unlike conventional driver attribute classifications based on factors such as gender, age, and experience, this checklist has been developed to focus on the driver’s internal characteris- tics. Based on the analysis of numerous previous studies (French et al., 1993, Taubman-Ben-Ari et al., 2004, West et al., 1993) on individual driving styles, the questionnaire consisted of the following eight dimensions:
Confidence in driving skills
Passive attitudes toward driving
Impatient driving tendencies
Methodical driving tendencies
Preparatory driving for traffic signals
Car as a status symbol
Unstable driving tendencies
Anxious tendencies Notably, the scores are treated as a metric for “Safe Driving Aptitude” after being quantified because the Driving Style Check Sheet measures how much an individual emphasizes safe driving in their usual driving behavior.
462 Yamanaka
Driving Workload Sensitivity Check Sheet The Driving Workload Sensitivity Check Sheet is a questionnaire compris- ing 38 questions about handling behaviors in one’s daily route selection and challenging driving environments. The responses are divided into five levels: “Driving without concern,” “Driving attentively without feeling burdened,” “Feeling a slight burden while driving,” “Experiencing a significant burden due to tension or pressure,” and “Feeling such a significant burden that you do not want to drive” (Akamatsu et al., 2004) (see Appendix II for the questionnaire results). This checklist has been developed to extract driver sensitivity to perceived burdens as driving characteristics, not only based on interactions with other drivers, as traditionally indicated, but also by asking about various stressors, such as accident experiences and road conditions. Therefore, based on previous studies (Gulian et al., 1989, Hill and Boyle, 2007, Kontogiannis 2006, Horberry et al., 2006) on how individual drivers perceive stress and burdens, the questionnaire consists of the following ten dimensions:
Perception of traffic conditions
Perception of the road environment
Hindrance to concentration when driving
Decreased physical activity
Hindrance to driving pace
Physical discomfort
Route understanding and exploration
In-car environment
Control operations
Driver’s posture In this study, because the Driving Workload Sensitivity Check Sheet measures the susceptibility of an individual to feeling burdened during regular driving, there might be a tendency to rely on the system in situations of increased burden. Therefore, after quantification, the scores are treated as a metric called System Dependency.
METHODOLOGY
The driving experiment was conducted using a DS (HONDA, DS-01). The driving course consisted of urban areas transitioning to mountainous sec- tions; it included interactions with other vehicles, pedestrians, signals, and six types of hazardous events. The DS utilized automatic transmission (AT) to simulate clear and dry weather conditions. The participants were 15 uni- versity students (7 males and 8 females) between 20 and 23 years of age, all holding regular automobile licenses with AT transmission capabilities or higher. The experiment was conducted after obtaining written consent from the participants after sufficient explanation of the experiment content. Also, they underwent prior familiarization with DS operations.
They drove in a comfortable posture while obeying traffic regulations, representing their usual driving state, without the use of sensors or other
Driver Attribute Classification Method Based on Driving Behavior 463
equipment. The entire experiment lasted for approximately one hour with driving sessions of approximately 10 min each.
The experimental procedure on the day of testing is illustrated in Figure 1.
Figure 1: Experimental schedule.
Figure available in the original PDF paper.
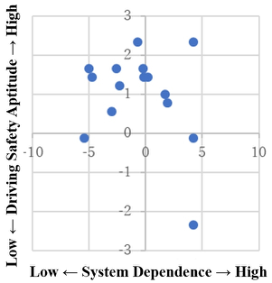
Evaluation Indices A two-dimensional coordinate system was constructed by plotting a safe driv- ing aptitude score obtained from the Driving Style Check Sheet on the vertical axis, and system dependence score obtained from the Driving Workload Sen- sitivity Check Sheet on the horizontal axis. Thus, each driver’s observation point was plotted, enabling the confirmation of their quadrant (Figure 2).
The quadrant to which each driver belonged based on the driving logs were predicted. These driving logs included 16 variables extracted from experi- mental driving, such as vehicle speed and brake frequency, which were used as driving behavior parameters. Notably, the predictions made from the driv- ing logs were conducted separately for the safe driving aptitude and system dependency attributes.
Figure 2: Driver attribute distribution.
RESULTS AND DISCUSSION
A multiple regression analysis was performed, with the objective variables being the scores for safe driving aptitude and system dependency, and the combinations of driving behavior parameters as explanatory variables. The results of the predictive model using the optimal parameters are presented below.
Equation (1) represents the predictive model for safe driving aptitude.
Equation reproduced from the original PDF.
464 Yamanaka
where, y1 is safe driving aptitude, x1 is red signal accelerator-brake transi- tion time, x2 is brake frequency, x3 is pedestrian-crossing intersection passage time, and x4 is brake opening degree mode.
Equation (2) represents the predictive model for system Dependency.
y2 = 6.910 −0.157x1 −2.079x2 (2) where, y2 is system dependency, x1 is red signal braking time, and x2 is number of accidents.
Cross-validation was performed to assess the accuracy of the predictive models for each driver attribute. For each of the participants, a multiple regression equation was derived using the data from the other 14 participants, which was then used to predict and classify the one remaining participant. Tables 1 and 2 present the results of the accuracy validation for each driver attribute prediction.
Table 1. Accuracy validation for safe driving aptitude.
Table available in the original PDF paper.
Predicted value High Low
Equation reproduced from the original PDF.Table 2. Accuracy validation for system dependency.
Table available in the original PDF paper.
Predicted value High Low
Equation reproduced from the original PDF.
Based on Tables 1 and 2, it can be observed that the prediction accuracy of the safe driving aptitude was quite high. However, there is room for improve- ment in the predictive accuracy of system dependency, which serves as a metric indicating the extent to which drivers seek driving assistance and is distinct from driving workload sensitivity. In other words, it is a measure to enhance driving comfort beyond safe driving aptitude alone. For vehicle safety, it is important to emphasize recall to ensure that drivers who desire the system receive assistance. However, focusing solely on recall may lead to concerns about a decrease in user experience among drivers who do not wish for system intervention. Therefore, for a more comfortable driving environ- ment, it is necessary to re-evaluate the system dependency prediction model to increase precision while maintaining recall. Furthermore, a common aspect among the explanatory variables of the prediction model was the presence of actions and behaviors related to deceleration, such as brake operations. These driving behavior parameters were correlated (R > 0.4) with each driver
Driver Attribute Classification Method Based on Driving Behavior 465
attribute. This suggests that the tendencies of individual driver characteristics are more likely to manifest during deceleration-related driving actions and vehicle behaviors. Consequently, collecting a greater number of deceleration- related driving behavior parameters could improve the accuracy of driver attribute prediction models.
CONCLUSION
To summarize the results, the following points constituting the conclusions were drawn:
1. It was proposed to predictive models for two types of driver attributes (i.e., safe driving aptitude and system dependency) based on DS logs. This enables the automatic provision of safe and comfortable driv- ing assistance systems from the vehicle to any driver, considering their awareness of safe driving and tendencies toward utilizing driving assis- tance systems. 2. The driver attribute types were found to correlate with actions and behaviors related to deceleration, such as braking. This suggests that individual driver characteristics are more likely to manifest during deceleration-related driving actions, thereby enhancing the understand- ing of driver behavior.
ACKNOWLEDGMENT
This work was supported by JSPS KAKENHI, Grant Number 23K04313, and MEXT (Japan).
REFERENCES
Akamatsu, M., Kurahashi, T. and Ishibashi, M. (2004). Driver’s characteristics index of driving style/workload sensitivity for a driving behavior study. Journal of Society of Automotive Engineers of Japan, Volume 58, No. 12. Cabinet Office, Japan. (Accessed on July 2, 2019). White paper on traffic safety in
Japan (in Japanese). Website: https://www8.cao.go.jp/koutu/taisaku/r01kou_hak u/pdf/zenbun/1-1-1.pdf. French, D. J., West, R. J., Elander, J. and Wilding J. M. (1993). Decision-making style, driving style, and self-reported involvement in road traffic accidents. Ergonomics, Volume 36, No. 6. Government CIO’s portal, Japan. (Accessed on June 7, 2019). Public-Private ITS
Initiative/Roadmap 2019 (in Japanese). Website: https://www.kantei.go.jp/jp/ singi/it2/kettei/pdf/20190607/siryou9.pdf. Gulian, E., Matthews, G., Glendon, A. I., Davies, D. R. and Debney, L. M. (1989).
Dimensions of driver stress. Ergonomics, Volume 36, No. 6. Hill, J. D. and Boyle, L. N. (2007). Driver stress as influenced by driving maneuvers and roadway conditions. Transportation Research: Part F, Volume 10, No. 3. Horberry, T., Anderson, J., Regan, M. A., Triggs, T. J. and Brown, J. (2006).
Driver distraction: The effects of concurrent in-vehicle tasks, road environment complexity, and age on driving performance. Accident Analysis and Prevention, Volume 38, No. 1.
466 Yamanaka
Kontogiannis, T. (2006). Patterns of driver stress and coping strategies in a Greek sample and their relationship to aberrant behaviors and traffic accidents. Accident Analysis and Prevention, Volume 38, No. 5. Taubman-Ben-Ari, O., Mikulincer, M. and Gillath, O. (2004). The multidimen-
sional driving style inventory-scale construct and validation. Accident Analysis and Prevention, Volume 36, No. 3. West, R., French, D., Kemp, R. and Elander, J. (1993). Direct observation of driving, self-reports of driver behavior, and accident involvement. Ergonomics, Volume 36, No. 5.
LISTED IN THE AHFE DIGITAL BOOKSTORE CATALOGUE
Explore the complete digital volume
Application of Emerging Technologies
Read this individual research paper free through the original publisher, or explore the full digital proceedings book.
ISBN 978-1-958651-91-9
Explore this ISBN in the AHFE Bookstore ↗Listed in the July 2026 bookstore catalogue; search by ISBN to confirm current availability · Digital book purchase optional