Noopur Anand, Manoj Tiwari (2024). Comprehensive Analysis of Body Shapes in the Indian Female Population: A National and Regional Study. In: Human Factors for Apparel and Textile Engineering. AHFE Open Access, vol. 134, pp. 63–76. https://doi.org/10.54941/ahfe1004915
India relies on anthropometric data sourced from foreign nations to develop products, resulting in a formidable challenge for Indian consumers in their quest for products tailored to their specific bodily attributes. The garment industry, in particular, grapples with this issue, where Indian consumers must often compromise on the fit of clothing due to the absence of comprehensive databases pertaining to Indian body shapes and sizes. Recent reports underscore the gravity of this situation, revealing that garment returns account for a substantial 20% to 40% of sales, a trend exacerbated by the burgeoning e-commerce sector.In response to this pressing need, a nationwide anthropometric survey was meticulously conducted, leveraging state-of-the-art 3D whole-body scanning technology. This extensive study encompassed a cohort of more than 13,000 female volunteers (total subjects scanned 13045 and valid subjects 12492), aged 15 to 70, meticulously selected to represent all states across India's six distinct geographic regions. Systematically, the data collected was subjected to clustering, resulting in the categorization of body shapes, both at the regional and national levels. This classification process was anchored in robust measurements of height and key girth dimensions, with a specific focus on Bust, waist, hip, and upper hip girths. This indigenous research unveiled the four most prevalent body shapes among Indian females: Hourglass, Rectangle, Trapezoid, and Bottom hourglass. Furthermore, a comprehensive regional analysis of body shapes was conducted, and it was found that while regional variations existed, the fundamental body shape clusters among Indian females remained consistent with the national clusters. The regions displayed the same four primary body shapes for females, with variations in the prevalence of these identified shapes. This groundbreaking study underscores the necessity of considering regional variations in product design and sizing to cater to the diverse Indian population accurately.
With approximately 1.4 billion people, India is the most populated nation in the world (Worldometer, 2023). It is also the fifth largest economy (Forbes,
2023) with consumer market expected to become the third largest (after the US and China) in the world by 2027 (Jacob, 2023).
Better fits are essential for women’s wear, given the predominant focus on the female body type in apparel selection. Female bodies, in contrast to male bodies, exhibit greater diversity in shapes. Research on Indian female body forms and their correlation with clothing fit remains largely unexplored. The entire Indian population faces apparel fit issues due to the absence of size charts tailored to Indian body dimensions. While some research has been conducted in this area, it remains limited in scope and scientific rigor.
This research paper examines the analysis of body shapes among Indian women, both on a national and regional scale, through a comprehensive investigation of the Indian female population. The study offers a robust mechanism for identifying body shapes. Based on indigenous research, the four most prevalent body shapes among Indian women are Bottom hour- glass, Hourglass, Rectangle, and Trapezoid. This study not only illuminates the distinct body types of Indian women but also provides valuable insights for companies striving to create better-fitting products, thereby enhanc- ing customer satisfaction and reducing financial losses linked to returns. Moreover, it underscores the importance of considering regional varia- tions in product design and sizing to cater effectively to the diverse Indian populace.
Apparel Fit Issues A significant portion of shoppers report having trouble finding clothes that are the appropriate fit for their body dimensions, according to global research studies on fit and human body measures. The main cause is disparities in the anthropometric make-up of people in various nations and even geographical locations of the world.
DesMarteau (2000) talked on the significance of fit, the causes of garment misfit, and its effects on service providers and consumers. According to a KSA survey, 50% of women and 62% of men struggle to find clothing that fits well, and other studies have found that 50% of catalogue returns are due to fit issues (DesMarteau, 2000). The lack of standardized Indian Size charts continues to be a key problem for clothing fit. There is a lack of comprehen- sive anthropometric data for Indian men that can be used to represent the entire nation and whose dimensions can be used for a variety of purposes, including clothing (Chakrabarty, 1997), (Anand, 2011).
In terms of anthropometric applications in clothing sizing, research has been conducted in India, however it hasn’t received much attention. The results of the research were also not commercialized or employed in mass production (Tiwari, 2017). Currently, body-fitting, sewn clothing is preferred over conventional draping clothing. Due to this change in desire, clothing must now be mass-produced to fit Indian bodies, necessitating the develop- ment of an Indian body size chart. Due to the lack of such standards, the Indian clothing industry has been adopting American, European, and British body size measurements, which frequently results in poorly fitting clothing
Comprehensive Analysis of Body Shapes in the Indian Female Population 65
(Ministry of Textiles, 2018). Currently, manufacturers “adapt” or “tweak” size charts from various nations based on their “instinct”and “experience”to create a size chart for their brand (Anand, 2011). Poor garment fit is cited as the astounding and predominant cause of the projected 25 to 40% returns for garments (Forum, 2020) which are rising with the expansion of e-commerce (Vidya, 2022).
Shape Analysis A sizing system indicates the total range of sizes based on the grading of dimension for a boy type (Glock & Kunz, 2005) and fitting combinations available in the garments (Cooklin, 1992). The size charts are developed as per the garment type (i.e. upper body garments or lower body garments or innerwear garment etc.) and the body type of the target market (Aldrich, 1980). Boswell (1993) discusses the requirement of a unique subset of tech- nical descriptors indicating information about whom that garments would fit. “Drop” is also such a technical descriptor that is a relationship between two body dimensions, i.e. difference between chest girth and waist girth used for tailored suits for male bodies. The drops are dependent on the body shapes (Boswell, 1993).
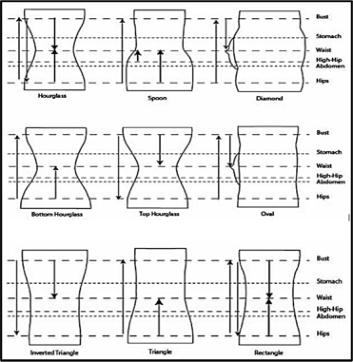
Figure 1: Female body shapes as derived from FFIT model.
The researchers also investigated the relationship of drops to male body shapes for developing sizing systems. The 3D scan data used for male body shape classification was from the SizeUSA. Three drops as Chest-Waist, Hip- Waist, and Hip-Chest were used for body shape classification, and four body shapes were identified as slim shape, heavy shape, slant inverted -triangle shape, and short round top shape (Shin et al., 2011).
Two different approaches 1. Cluster analysis, and 2. Shape cluster iden- tification using a Microsoft Excel based MSIT (Male Shape Identification Technique). Five drop combinations as chest-waist, hip-waist, chest-high hip, waist-high hip, and hip-high hip measurements were used for body shape identification using MSIT (Male Shape Identification Technique) (Wilson & Istook, 2019), (Wilson, 2016).
Factor Analysis Principal Component Analysis (PCA) is a variable reduction technique. Application of factor analysis using principal component analysis is used for data reduction/data compression into a few factors indicating key dimensions.
The factor analysis using Principal Component Analysis (PCA) has been widely used by various researchers in the anthropometric data analysis including Salusso (1985) in selecting dimensions for bivariate classification (Salusso et al., 1985), Salusso et al. (2006) while adopting an alterna- tive approach named as principal component sizing system (PCSS) to sizing apparel for women of age 55 years and above (Salusso et al., 2006). By look- ing at factor loading values, one may verify that the PCA’s method of choosing key or control measurements is based on their relationship and correlation with other measurements (Zakaria, 2014), (Veitch et al., 2007).
Clustering Cluster analysis is one of the key data mining techniques used for data reduc- tion through data classification. In the context of anthropometric research, the cluster analysis may be applied to classify the subject population into homogeneous groups (Zakaria & Gupta, 2014).
Comprehensive Analysis of Body Shapes in the Indian Female Population 67
METHODS AND TECHNIQUES Subject Profile
This study included total of more than 13,000 female volunteers (total sub- jects scanned 13045 and valid subjects 12492) aged between 15 years and 70 years spanning in eleven age groups (refer Table 1) from the six geographic regions of India, five income groups and two communities as rural and urban.
The sample size for the data collection was statistically determined using stratified sampling technique applied on the census data of 2011. The six geo- graphic regions included North, West, South, Central, East, and North-east regions. The age range of the subjects for the study was as per the definitions of National Youth Policy, 2014 (Ministry of Youth Affairs and sports, 2014) and National Council for Older People 2014 (Ministry of Social Justice & Empowerment, 2014). As recommended in the ISO 15535:2012, the subjects were divided into age groups of 5 years multiples (ISO 15535, 2012). The income categories of the subjects were based on the annual household income as per the BCG report on Indian consumers. The five income categories included as Elite : annual household income above Rs. 20 lacs; Affluent : annual household income between Rs. 10.0 to 20.0 lacs; Aspirers : annual household income between Rs. 5.0 to 10 lacs; Next Billion : annual house- hold income between Rs. 1.5 to 5.0 lacs; and Strugglers : annual household income below Rs. 1.5 lacs (Sanghi et al., 2017).
Data Collection The data was collected using 3D body scanning. The subjects were randomly measured manually on some key dimensions to check the 3D body scan- ner performance. Due ISO recommended protocols (such as ISO 8559:1989, ISO 20685:2005 and ISO 20685:2018) were followed to ensure the accu- racy and validation of the 3D body scanners (Tiwari & Anand, 2020), (Tiwari & Anand, 2022). The anthropometric data was collected on various
68 Anand and Tiwari
body dimensions including various heights from floor, girth measurements, depth/length measurements, segment lengths, and arc measurements as per the postures as recommended by ISO 20685: 2010-11. The definition of the body dimensions for landmark identification was ISO 8559-1:2017 and ISO 7250-1:2017 protocols. The dimensions were selected as per industry requirements to make different apparel products.
Data Preparation The data preparation process included obtaining the composite file of anthro- pometric measurements as captured by 3D body scanning. In the next step, the data was cleaned by treating the extreme values and outliers which were abnormal and falling beyond ± three σ (Standard deviation) limits (Hsu, 2009), (Moon & Nam, 2003). Then the data was exported to IBM SPSS V. 28 for basic statistical analysis including descriptive statistics, factor analy- sis, and clustering. Post cleaning, the data of collected body dimensions was tested for normality, and it was observed that the data was almost normality distributed for the given body dimension.
Data Classification The data classification was primarily done using IBM SPSS Modeler V. 18.2. The data was classified in total five height categories based on the standard deviation, and the body shape categories as identified using k-means cluster- ing technique based on the six drop combinations as discussed in the next sub-sections.
Data Validation Data validation was done by conducting 1. Test of sample adequacy, 2. Test of sphericity, and 3. Test of internal consistency of the data. These tests are prerequisite to conduct factor analysis, and ensure that the data set is suitable for further analysis (Zakaria, 2014).
1. Test of sample adequacy: The Kaiser-Meyer-Olkin (KMO) value was cal- culated as a measure of sampling adequacy of data. The KMO value observed was 0.951, which can be considered as excellent in comparison the acceptable value of 0.60 (Hrženjak et al., 2015). 2. Test of sphericity: The Bartlett’s test is used to check for the sphericity of the data by checking the checks for the redundancy between the variables. The Bartlett’s test result value observed was nearing 0. The test result which is less than 0.05 confirms the sphericity of data and considered as acceptable (Hsu et al., 2007). 3. Test of consistency and unidimensionality of the data: Cronbach’s alpha was used to check the internal consistency (reliability) of the data. The Cronbach’s alpha values ranges between 0 and 1 and higher score indi- cates more reliability. Cronbach’s alpha value ≥0.6 is treated as satisfac- tory for data consistency (Cronbach, 1951). The Cronbach’s alpha value observed for the dataset was above 0.95, hence the unidimensionality of the data was confirmed.
Comprehensive Analysis of Body Shapes in the Indian Female Population 69
Factor Analysis Principal component analysis was used to apply the factor analysis and reduce the amount of data in to some key factors. Following the Kaiser criterion (latent root criterion), variance criterion, scree plot, and eigenvalues, the important factors were found. The girth factor and height factor were the main factors that had eigenvalues greater than one. Principal component analysis was used to determine two main factors: length factor and girth factor.
The first two components have eigenvalues greater than 1 and the greatest possible variance coverage. The first component covered a variance of 42.44 percent, while the second component a variance of 32.152 percent. Together, these two elements accounted for 74.59 percent of the variance. The accepted recommendation is that these chosen components should account for at least 60% of the total variance in order to demonstrate the value of PCA. In this study, compared to the minimum required threshold of 60 percent, the first two components explained more variance (74.59%) (Malhotra, 2010).
The rotated component matrix indicating dimensions with factor loading >= 0.90. Stature (height) with 0.936 loading factor was observed among the top dimensions with the highest factor loadings with the length component. Since the key dimensions must be easy to measure and the body dimensions should be familiar for everybody, height was considered as one of the param- eter for the data classification (Moon & Nam, 2003). Among the girths, Upper Hip Girth, Bust girth, Waist girth, and Hip girth were observed as the dimensions with highest factor loading. Height Categories The mean height was observed as 151.73 cm with a standard deviation of 6.28 cm. As the data witnessed a near normal distribution with the skewness observed as 0.072, while median and mode values 151.57 cm and 155.01 cm, respectively. For convenience in height categorization, the central value was considered as 152.0 cm, and the central height category was determined with +/−4.0 cm from this value. The total dataset was divided into five height categories as indicated in Table 2. It can be noticed that the Aver- age height category covered almost 48% of the subjects, followed by Short normal (24.71%), and Tall normal category with 22.11%. The categories Short and Tall height categories covered relatively lesser number of subjects with just 2.86% and 2.79% subjects respectively. The central three height categories covered a whopping 94.35% of the subjects.
Table 2. Height categories.
Table available in the original PDF paper.
Sr. No. Height Category Name Height Range (cm.) Percentage Share 1 Short Height <140.00 cm 2.86% 2 Short Normal >=140.00 cm to <148.00 cm 24.71% 3 Average >=148.00 cm to <156.00 cm 47.53% 4 Tall Normal >=156.00 cm <164.00 cm 22.11% 5 Tall Height >=164.00 cm 2.79% Total 100.00%
70 Anand and Tiwari
Drop Combinations for Body Shape Clustering Data clustering was done based on the different drop combinations by select- ing the girth dimensions. The selection of the girth dimensions was based on the factor loading as observed in the PCA. Six different drop combina- tions were identified for the clustering analysis as Bust – Waist, Hip – Waist, Bust – Hip, Bust – Upper Hip, Hip – Upper Hip, and Waist – Upper Hip. The k-means clustering was applied for the body shape analysis, and total 4 different clusters (body shapes) were identified for the female population. The identified body shapes are indicated in the Table 3.
Table 3. Body shape clusters.
Table available in the original PDF paper.
Body Shapes Clusters Female Drop Combination Body Shape
As mentioned in the Table 3, total 6 drop combinations (D1 to D6) were employed for clustering of the data. clustering The values associated with the drop combinations represent the average difference between the dimensions of that drop combination for a given body shape. For instance, in case of the Hourglass body shape, the average difference between bust girth and waist girth is 11.38 cm, while the same difference is 5.97 cm, 7.13 cm, and 12.97 for the Rectangle, Trapezoid, and Bottom Hourglass shapes respectively.
The clustering of the anthropometric data based on the 6 drop combina- tions revealed relationship among the key body dimensions i.e. bust girth, waist girth, and hip girth. These relationships, or rules, are valuable may be useful in defining the body shapes for the India female population is indicated in Table 4.
Table 4. Body shapes and relationship among body dimensions.
Table available in the original PDF paper.
Relationship Among Body Dimensions Remark Body Shape This shape can be classified as Hourglass due to the noticeable difference between Bust and Waist girth.
Hourglass Difference between Bust girth and Waist girth is between +11 cm to +12.0 cm. Difference between Bust girth and Hip girth is between -4.0 cm. to +1 cm. Difference between Hip girth and Waist girth is between +11.0 cm. to +15.0 cm.
(Continued)
Comprehensive Analysis of Body Shapes in the Indian Female Population 71
Table 4. Continued Relationship Among Body Dimensions Remark Body Shape
Table available in the original PDF paper.
Rectangle Difference between Bust girth and Waist girth is +5 cm to +7.0 cm. Difference between Bust girth and Hip girth is between -3.0 cm. to +3.0 cm. Difference between Hip girth and Waist girth is between +4.0 cm. to +8.0 cm.
This shape can be classified as Rectangle because the measurements indicate a relatively similar distribution of girth throughout the body. Trapezoid Difference between Bust girth and Waist girth is between +6.0 cm to +8.0 cm. Difference between Bust girth and Hip girth is between -11.0 cm. to -9.0 cm. Difference between Hip girth and Waist girth is between +16.0 cm. to +19.0 cm.
This shape can be classified as Trapezoid due to the significant difference between Bust and Hip girths without a well-defined waist. Bottom Hourglass
Difference between Bust girth and Waist girth is +12 cm to +13.0 cm. Difference between Bust girth and Hip girth is between -9.0 cm. to -7.0 cm. Difference between Hip girth and Waist girth is between +19.0 cm. to +21.0 cm.
This shape can be classified as Bottom Hourglass because of the substantial difference between Bust and Hip girths and the presence of a defined waist.
From the Table 4, it is clear that the shapes identified are quite dis- tinguished from each other and can be noticed based on the conditions indicated.
National Shape Clustering The clustering of the entire data was done by combining all the geographic regions for identified body shapes with height categories. This distribution can be seen in the Table 5.
Table 5. Body shape clustering - national.
Table available in the original PDF paper.
Total
Geographic Region
Height Category Hourglass Rectangle Trapezoid Bottom Hourglass % Subjects All Regions Short 0.97% 0.76% 0.65% 0.48% 2.86% Short Normal 7.59% 6.27% 5.38% 5.48% 24.71% Average 12.67% 9.46% 11.42% 13.98% 47.53% Tall Normal 4.73% 2.93% 5.75% 8.70% 22.11% Tall 0.55% 0.21% 0.71% 1.32% 2.79% Total 26.51% 19.63% 23.90% 29.96% 100.00%
The analysis reveals (refer Table 5) that the Bottom Hourglass body shape category, characterized by relatively larger hip girth, and hip girth by an average of 20.42 cm as compared to the waist girth, is the most prevalent, encompassing 29.96% of the subjects. Following closely, the Hourglass cat- egory, where both the bust girth and the hip girth are more or less same, but
72 Anand and Tiwari
the waist girth is relatively smaller, constitutes 26.51% of the subjects. The Trapezoid body shape, where waist girth is smaller than hip girth by aver- age 14.0 cm, and bust girth is smaller than hip girth by 9.4 cm constituted 23.90% subjects. The Rectangle body shape, in which the bust, waist, and hip girths are nearly identical, accounts for 19.63% of the subjects.
Within the “Average height” category, with 13.98% of the subjects are represented, the Bottom hourglass body shape remains the dominant choice. It is followed by the Hourglass shape at 12.67%, Trapezoid shape at 11.42%, and Rectangle shape at 9.46% for individuals of the same height category. It is worth noting that body shapes in the “Short” and “Tall” height categories have a substantially smaller presence, each constituting less than 2.0% of the total subjects. Consequently, it is advisable to exclude these shape categories when developing a size chart (Petrova, 2007), (Kwon et al., 2009), (Zakaria, 2011).
Regional Shape Clustering The body shape clustering pattern with respect to height categories was also checked for the geographic regions. The objective was to investigate and understand the body shape deviations in the given geographic regions from the national shape pattern. Further, in case there are significant deviations in the shape in some specific geographic regions, it may justify the requirement for creating an exclusive size charts for such geographic region(s).
RESULTS AND DISCUSSIONS The regional analysis of female body forms unveiled crucial insights into body shape patterns across different geographical regions of India, highlighting disparities from the national body shape clusters.
Regional body shape clustering showcased diverse patterns. Notably, none of the regions precisely mirrored the national clustering, with North India, East India, and North-east India showing a predominant Hourglass body shape, followed by Bottom Hourglass, Rectangle, and Trapezoid. It’s worth mentioning that North India and North-east India had slight variations in populations with Hourglass and Bottom Hourglass shapes, reflecting a 3.44% difference. Conversely, West India and South India exhibited a reverse body shape sequence. In West India, the predominant shape was Bottom Hourglass, fol- lowed by Trapezoid, Rectangle, and Hourglass, while South India displayed the reverse order. Central India had the highest population with Trapezoid (38.4%), followed by Bottom Hourglass, Rectangle, and Hourglass.
In the North-east India region, the majority of subjects fell within the Short Normal (Height >= 140 cm and < 148 cm) and Average (Height >= 148 cm and < 156 cm) height categories, accounting for approximately 78%. This shift towards shorter height categories led to the emergence of Hourglass body shape as a valid category for the Short height group (comprising over 2% of subjects). The variations in body shape patterns in North-east India may be attributed to the relatively shorter height of the population in this region.
Comprehensive Analysis of Body Shapes in the Indian Female Population 73
In South India, the observation of Bottom Hourglass shape in the Tall height category was significant. The inclusion of these new shape categories in North-east India and South India is valuable for brands and clothing manufacturers catering to region-specific consumers.
CONCLUSION
It is evident that different geographic regions show varied body shape pat- terns and such regional body shape patters do not align with the national body shape patterns. Here are the key observations:
For the Average height group, West, South and Central India exhibited similar body shape patterns, featuring the Bottom Hourglass and Trape- zoid body shape as the as the predominant categories with marginal differ- ence, followed by Hourglass and Rectangle body shapes. The North India and North-east India displayed similar body shape patterns with Bot- tom Hourglass and Hourglass as leading shape categories with marginal difference followed by Rectangle and Trapezoid body shapes.
In the Short Normal height category, the body shape patterns of West, South and Central India showed consistent body shape patterns with Trapezoid shape being the most prevalent, followed by Rectangle, Hour- glass, and Bottom hourglass shape categories. In the North India, Hour- glass body shape took precedence, followed by Bottom hourglass and Rectangle with same percentage share of subjects followed by Trapezoid body shape. In the East India region, Hourglass body shape was followed by Rectangle, Bottom hourglass, and Trapezoid body shapes.
In the Tall Normal height category, the body shape patterns the body shape patterns of West, South and Central India were observed similar with Bot- tom hourglass as the leading shape category, followed by Trapezoid, and Hourglass and Rectangle with marginal difference in the percentage share of subjects. North India and East India followed a similar body shape pat- tern like national body shape pattern, however in the East India region, there were marginal differences between Bottom hourglass and Hourglass, and Rectangle and Trapezoid body shape percentage coverage.
The North-east region, the Hourglass body shape dominated, followed by Bottom hourglass, Rectangle and Trapezoid body shapes. In the height categories, Average height and Short Normal covered approximately 78% of the subjects. A substantial coverage of 36.56% in the Short Normal height maybe due to the relatively shorter stature of individuals in this region.
From a size chart development perspective, considering the wide range of height categories (with the central three height categories covering 94.35% of the subjects across all three body shape categories), it is anticipated that subjects from the North-east region can be accommodated within the same national size charts.
This ground-breaking research study focuses on the diverse spectrum of Indian female body forms, meticulously classifying them into four distinct body types based on crucial body measurements, including Bust girth, Waist
74 Anand and Tiwari
girth, and Hip girth. This research serves as a robust foundation for the devel- opment of a comprehensive sizing system based on body shape, specially tailored for Indian females.
REFERENCES
Aldrich, W., 1980. Metric pattern cutting for menswear: Including unisex clothes and computer aided design. Cambridge (Massachusetts): Blackwell Science. Anand, N., 2011. Size does matter- Need for “SizeIndia”-National Body Siz-
ing Survey of India. [Online] Available at: http://www.techexchange.com/ library/Size%20does%20matter%20-%20Need%20for%20Size%20India%20 %20National%20Body%20Sizing%20Survey%20of%20Indian.pdf [Accessed July 2012]. Boswell, S., 1993. Menswear: Suiting the Customer. s.l.: Prentice Hall. Chakrabarty, D., 1997. Indian Anthropometric Dimensions: For Ergonomic Design Practice. Ahmedabad: National Institute of Design. Connell, L. et al., 2002. Body scan analysis for fit models based on body shape and
posture analysis, South Carolina: National Textile Center. Cooklin, G., 1992. Pattern Grading for men’s clothes: the technology of sizing. s.l.: Blackwell Scientific Publications. Cronbach, L. J., 1951. Coefficient alpha and the internal structure of tests. psychome-
trika, 16(3), pp. 297–334. DesMarteau, K., 2000. CAD: Let the fit revolution begin. Bobbin 42, 42(2), p. 42. Fairhurst, C., 2008. Advances in apparel production. s.l.: Elsevier. Forbes, 2023. The top 10 largest economies in the world in 2023. [Online] Available at: https://www.forbesindia.com/article/explainers/top-10-largest-economies- in-the-world/86159/1#: ∼: text=India%20is%20ranked%205th%20in, services%2C%20agriculture%2C%20and%20manufacturing. [Accessed October 2023]. Forum, G., 2020. Free returns, a way to lure customers to do online shopping.
[Online] Available at: https://www.thehindubusinessline.com/companies/free- returns-a-way-to-lure-customers-to-do-online-shopping/article32069191.ece [Accessed August 2020]. Glock, R. E. & Kunz, G. I., 2005. Apparel manufacturing: Sewn product analysis.
Upper saddle River (New Jersey): Person Education. Hrženjak, R., Doležal, K. & Darko, U., 2015. Sizing system for girls aged 13–20 years based on body types. Textile Research Journal, July, 85(12), pp. 1293–1304. Hsu, C.-H., 2009. Data mining to improve industrial standards and enhance produc-
tion and marketing: An empirical study in apparel industry. Expert Systems with Applications, Volume 36, pp. 4185-4191. Hsu, C.-H., Lin, H.-F. & Wang, M.-J., 2007. Developing female size charts for facilitating garment production using data mining. Journal of the Chinese Institute of Industrial Engineers, 24(3), pp. 245–251. ISO 15535, 2012. General requirements for establishing anthropometric databases,
Geneva: ISO. Jacob, C., 2023. India’s consumer market set to become the world’s third largest by 2027, behind the U. S. and China. [Online] Available at: https://www. cnbc.com/2023/09/07/india-consumer-market-to-be-the-worlds-third-largest- by-2027-report-.html#: ∼: text=Nurphoto%20%7C%20Getty%20Images-, India’s%20consumer%20market%20is%20set%20to%20become%20the%20 world’s%20third, push%20India%20up%20two%20spots [Accessed September 2023].
Comprehensive Analysis of Body Shapes in the Indian Female Population 75
Kwon, O., Jung, K., You, H. & Kim, H.-E., 2009. Determination of key dimensions for a glove sizing system by analyzing the relationships between hand dimensions. Applied Ergonomics, 40(4), pp. 762–766. Lee, J. H., 2004. Analysis of head shape of college students for the headgears. Journal
of the Korean Society of Clothing and Textiles, 28(1), pp. 182–188. Malhotra, N. K., 2010. Marketing research: an applied orientation. NewDelhi: Pearson. Ministry of Social Justice & Empowerment, 2014. National policy for older peo-
ple 2014 (NPOP 2014), New Delhi: Ministry of Social Justice & Empowerment, Government of India. Ministry of Textiles, 2018. Study on Garment Sector to Understand their Requirement for Capacity Building, New Delhi: Ministry of Textiles, Government of India. Ministry of Youth Affairs and sports, 2014. National Youth Policy 2014, New Delhi:
Ministry of Youth Affairs and sports, Government of India. Moon, J. Y. & Nam, Y. J., 2003. A study the elderly women’s lower figure type classification and lower garment sizing systems. Korea, s.n. Petrova, A., 2007. Creating sizing systems. In: Sizing in clothing: Developing effec-
tive sizing systems for ready-to-wear clothing. Cambridge: Woodhead Publishing Limited, pp. 57–87. Salusso, C. J., Borkowski, J. J. & Reich, N., 2006. An alternative approach to sizing apparel for 55 and older. Clothing & Textiles Research Journal, 24(2), pp. 96–111. Salusso, D. C., DeLong, M., Martin, F. & Krohn, K., 1985. A multivariate method of
classifying body form variation for sizing women’s apparel. Clothing and Textiles Research Journal, Volume 4, pp. 38–45. Sanghi, A., Jain, N. & Sanghi, K., 2017. The New Indian: The Many Facets of a Changing Consumer. [Online] Available at: https://www.bcg.com/publications/2017/marketing-sales-globalization-new- indian-changing-consumer [Accessed February 2018]. Shin, S.-J. H., Istook, C. L. & Lee, J.-H., 2011. Various men’s body shapes and drops for developing menswear sizing systems in the United States. Journal of the Korean Society of Clothing and Textiles, 35(12), pp. 1454–1465. Simmons, K. P., Istook, C. L. & Devarajan, P., 2004. Female figure identification tech-
nique (FFIT) for apparel part II: Development of shape sorting software. Journal of Textile and Apparel Technology and Management, 4(1). Tiwari, M. & Anand, N., 2020. Validation and reliability of sizestream 3D scanner for human body measurement. Singapore, Springer, pp. 13–23. Tiwari, M. & Anand, N., 2022. Validation and Reliability of Sizestream 3D Scanner
Using Regression Modeling. New York, AHFE, pp. 169–176. Tiwari, M., 2017. Size Chart Standardization of Bottom-wear for Indian Male Youth (18-29 years), New Delhi: National Institute of Fashion Technology. Veitch, D., Veitch, L. & Henneberg, M., 2007. Sizing for the Clothing Industry
Using Principal Component Analysis—An Australian Exampls. Journal of ASTM International, 4(3). Vidya, S., 2022. Size stumps sales of apparel online. [Online] Avail- able at: https://www.indiatoday.in/mail-today/story/size-stumps-sales-of-apparel- online-1596994-2019-09-08 [Accessed 2022 August]. Wilson, A. & Istook., C. L., 2019. Body Shape Classifications of Males 26 to 35 Using Size USA Three-Dimensional Scan Data. s.l., Iowa State University Digital Press.
76 Anand and Tiwari
Wilson, A., 2016. Body Shape Classifications of Males 26 to 35 Using Size USA Three-Dimensional Scan Data, s.l.: North Carolina State University. Zakaria, N. & Gupta, D., 2014. Apparel sizing: existing sizing systems and the
development of new sizing systems. In: D. Gupta & N. Zakaria, eds. Anthro- pometry, apparel sizing and design. Cambridge: Woodhead Publishing Limited in association with the Textile Institute, pp. 3–33. Zakaria, N., 2011. Sizing system for functional clothing- Uniforms for school children. Indian Journal of Fibre & Textile Research, Volume 36, pp. 348–357. Zakaria, N., 2014. Body shape analysis and identification of key dimensions for
apparel sizing systems. In: Anthropometry, apparel sizing and design. Cambridge: Woodhead Publishing, pp. 95–119.
LISTED IN THE AHFE DIGITAL BOOKSTORE CATALOGUE
Explore the complete digital volume
Human Factors for Apparel and Textile Engineering
Read this individual research paper free through the original publisher, or explore the full digital proceedings book.
ISBN 978-1-964867-10-6
Explore this ISBN in the AHFE Bookstore ↗Listed in the July 2026 bookstore catalogue; search by ISBN to confirm current availability · Digital book purchase optional