Manoj Tiwari, Noopur Anand (2022). Validation and Reliability of Sizestream 3D scanner using Regression modeling. In: Human Factors for Apparel and Textile Engineering. AHFE Open Access, vol. 32, pp. 169–176. https://doi.org/10.54941/ahfe1001552
3D scanning has evolved as one of the most advanced and accurate technology to measure humans and products. Quick and reliable results achieved by 3D scanning over manual measurements, make it the most preferred tool for measurement. 3D scanning has been extensively used in various national sizing surveys worldwide. The 3D scan results are compared to the manual measurements to establish the accuracy of the scanner. This research paper describes a novel and alternative approach to check the reliability and validity of the measures derived from 3D Body Scanner in comparison to measures provided by the manual measures.The 3-D Body scanning was done by Sizestream 3D Body Scanner - SS14. The manual body measurements were taken by experienced experts using an anthropometer, stadiometer, and certified flexible non-stretchable steel tape. In total 133 subjects (68 male and 65 female subjects) covering 102 body dimensions were taken manually and were used while comparing 3D scan measurements to establish the validity and reliability of the scanner. The procedure adopted for validation and reliability check for the 3D scanner was as prescribed in the ISO 20685(2005) and ISO 20685(2018). It was observed that the Sizestream - SS14 scanners used were highly consistent in measuring the subjects, though a systematic error was reported in the process failing some of the measurements in terms of accuracy levels (as per ISO 8559 and ISO 20685(2005)) achieved against manual measurements used as the gold standards. Subsequently, a novel approach based on regression modeling was applied to establish scanning accuracy.This research paper describes the validation and reliability procedure as per ISO protocols. It also discusses the regression-based statistical procedure adopted to confirm the desired measurement accuracy of the scanners within the permissible error limits of ISO 20685and ISO 8559.
Anthropometric dimensions are essential for any scientific product design, and it works as the foundation knowledge in the ergonomic user-centered design. Anthropometric measurements are widely used in several areas auto- mobiles, medical sciences, aviation, architecture, and of course apparel where it is extensively used for mass customization for an improved fit (Tiwari &
Anand, 2021). The traditional approaches of anthropometry are primarily contact-based methods that consume more time, effort as well as money. In the past few years, 3D body scanning technology has emerged as a key medium for human body measurements. It is a noncontact method that pro- vides faster and more accurate results. In the last 50 years, there have been several countries (including the USA, the UK, Germany, France, Japan, Korea, China, etc.) have undertaken their national sizing surveys using 3D body scanning. Currently, the INDIAsize (National Sizing Survey of India) is going on using 3D body scanning. This research paper discusses the procedure for validation and reliability of the 3D body scanners being used in the INDI- Asize survey. The background section provides necessary justification about the need for validation and reliability of the 3D body scanners. The methodo- logy section discusses the subject details, manual and 3D scanning procedures adopted, data preparation, and data analysis. The methods of applying a cor- rection factor (Bias-shift) and regression modeling and checking the results with ISO 8559:1989 and ISO 20685:2005 have also been discussed in this section. The key findings have been discussed in the results and discussion section while the last section provides the conclusion of the research and future directions.
BACKGROUND
In recent years, anthropometric data collection using 3D body scanning has gained popularity and it is preferred over manual measurement techniques. Still, the manual measurement techniques have maintained their importa- nce as these are considered gold standards while establishing the accuracy of the body measurements obtained using 3D body scanning. It becomes vital to establish the validity and reliability of the 3D body scanning systems to ensure that the output measurements are trusted and applied for further use. It is important to understand how the scanner extracted measurements are concurring with the measurements taken manually for the same dimensions (Mckinnon & Istook, 2001). There are several research works have been conducted to establish the validation and reliability of 3D body scanning systems. Also, there are some ISO standard procedures available to esta- blish 3D scanners’ reliability and accuracy. ISO 20685:2005 provides 3D scanning methodologies for internationally compatible anthropometric data- bases (ISO 20685, 2005). The ISO 20685:2015 provides guidelines about the evaluation protocol of surface shape and repeatability of relative lan- dmark positions (ISO 20685, 2015). Tiwari and Anand (2021) conducted the validation and reliability of 3D body scanning systems using a correction factor termed as Bais-shift (Tiwari & Anand, 2021). It was observed that the approach of applying Bais-shift was scientific and established, it has some challenges involved. There are different correction factors to be applied for different dimensions. The corrected values (after application of the Bais-shift) when evaluated against ISO standards, it may result in inconsistent output i.e. some of the measurements may pass and some of the measurement may fail with the latter happening when the errors are not systematic.
Validation and Reliability of Sizestream 3D Scanner Using Regression Modeling 171
METHODOLOGY
Procedure and Equipment In total 379 subjects (207 Males and 172 Females) with varied ages, shapes and sizes were measured using 3D body scanning. Out of these 379 subjects, 133 subjects (68 males and 65 females) were measured manually using the traditional approach. The manual anthropometric measurements were taken by the experienced anthropologists using certified tools such as a stadiometer, anthropometer, and steel tapes.
In total 102 body dimensions were measured using 3D scanning and manual body measurements. These 102 body dimensions included the dimen- sion categories as prescribed in the ISO 20685:2005.
The manual body measurements were taken by two (02) experienced anthropologists. Every subject was measured twice independently by the measurers in adherence to the prescribed protocol of ISO 8559:1989. The lengthwise body measurements (vertical dimensions) were taken using a cer- tified anthropometer and the sliding stadiometer (Length of 210 centimeters and least count 1.0 mm). The girth-related measurements (horizontal dimen- sions) were taken using a certified flexible non-stretchable steel tape (Length 200 centimeters and least count 1.0 mm). A mirror was fitted on the wall (behind the subject) to ensure the correct landmark positioning and place- ment of measuring tape. This entire exercise manual body measurement was conducted under the supervision of a senior anthropologist having more than 20 years of field experience. The 3D whole-body scanning of the subjects was conducted using the SS14 3D Body scanning system of Sizestream. SS14 scanners capture body measu- rements using infrared technology. ISO 20685:2005 protocol was followed while 3D scanning of the subjects. As per the standard practice, the scanners were duly calibrated at the start of the exercise on each. Each of the subjects was measured once using 3D Scanning and the scanning setting was kept at 3 bursts per scan. The final dimension for a given measurement was taken from the median value of the dimensions out of these three bursts. Each of the subjects was provided specially designed scan suits made of material with sufficient stretch to avoid body compression as well as any kind of slackness or looseness from the body. While 3D body scanning, the subjects were asked to maintain the posture as prescribed in the ISO 20685:2010-11.
Data Preparation Data preparation was done in the five steps as, 1. 3D body scan of the subjects and getting the composite file indicating median values of the measurements, 2. Manual body measurements (Each of the subjects was measured once by each of the two measures) and recording the measurement values in MS Excel file for every subject, 3. Preparing a combined data file with both the manual measurements values (named as M1 and M2) and 3D scan median values (names as S) for the selected 133 subjects, 4. Exporting the data file in SPSS V. 23 for further statistical analysis, 5. Data cleaning by identifying and removing the extreme values and outliers (the values beyond +/-3 Standard Deviation were discarded)
172 Tiwari and Anand
Data Analysis Statistical data analysis was undertaken with these steps,
Step 1. Calculating the mean value (termed as M) of the manual measure- ments as M1 and M2 for each of the subjects for every dimension.
Step 2. Calculated the mean difference by averaging all the differences between the scanner measurements and the average measurements taken manually (ISO 20685, 2005).
Step 3. Determining the Standard Deviation (SD) of the difference between scanner measurements and manual measurements (Kouchi & Mochimaru, 2011).
Step 4. Determining the error limits@95%confidence level using the mean of the differences (between scanner measurement and manual measure- ment) for each of the subjects and all the dimensions (Kouchi, 2014).
Step 5. Checking the mean differences using the test methods given in Clause 5 of ISO 20685:2005 (ISO 20685, 2015), (Han et al., 2010).
According to ISO 20685:2005, if the 95% confidence interval for the mean of regressed scan-minus-manual measure differences is within the plus or minus interval values (please refer to table 1), then the 3D scanning system can be considered acceptable (Tiwari & Anand, 2021), (ISO 8559, 1989). To accept the regressed scanner extracted measurements, both the upper value and lower value should be within the ISO 20685:2005 prescribed limit.
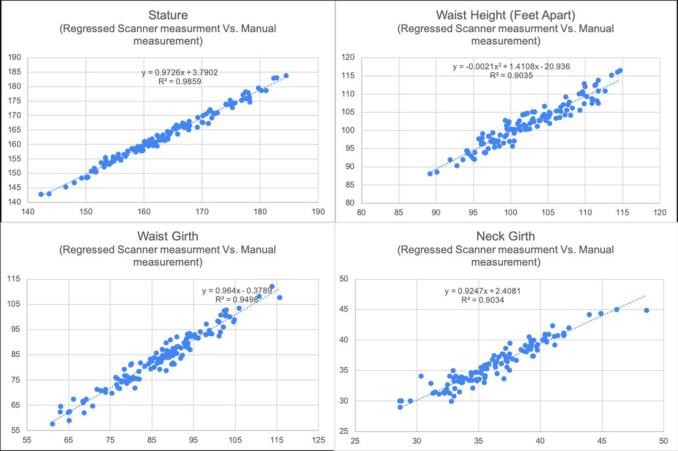
Step 6. Determining the regression equation between mean manual mea- surement value (M) and scanner measurement value (S). Here S was taken as an independent variable. Further, the scanner measurement value was regressed (termed as SR) for each of the dimensions. Scatter plots for some of the dimensions with regression equation and respective R2 values are illustrated in figure 1.
Step 7. Creating the normality plot for the residuals and homoscedasti- city (homogeneity of variances) was checked while applying regression to adjust scanned measurements.
Step 8. Checking the R2 values of the regression equations for each of the dimensions to confirm the robustness of the regression model, and predict the regressed scanner value (SR) as an outcome.
Step 9. Perform steps 2 to step 5 to check the mean differences using the test methods given in Clause 5 of ISO 20685:2005.
Step 10. Conducting performance test-retest procedure using 80% values to predict 20% of the values, and testing it against as per the ISO 20685:2005 protocol as well as per ISO 8559:1989 limits based on % error.
Step 11. Conducting paired comparison t-test between the regressed scan- ner measurement values and manual measurement values to identify and re-confirm (addition to the checking of error limits as mentioned in step 8 above) whether there is any significant difference between regressed scan- ner measurements (SR) and the average of the manual measurements (M). Regressed scanner values (SR) to be accepted if there is no significant difference between SR and M.
Validation and Reliability of Sizestream 3D Scanner Using Regression Modeling 173
Figure 1: Scatter plots (regressed scanner measurement vs. manual measurement).
While checking the scanner extracted values to the manual measurement values as per ISO 20685:2015 and ISO 8559:1989 standard acceptable error limits, it was observed that the upper and lower limit of all the differences were observed beyond the permissible limit except for a few dimensions as back neck height, shoulder height, upper hip height, calf height, midriff hei- ght, back neck point to waist (center back length), upper arm length, elbow girth, and wrist girth. Here it may be noted that the permissible error limits as prescribed in ISO 20685:2015 and ISO 8559:1989 standards are a bit stringent, and that may be the reason that the deviations between scanner extracted values and manual measurement values go beyond the permissible prescribed limits. However, in the context of apparel applications to achi- eve a good fit we may need to relax such limits in due consultation with the clothing fit experts.
The checking of regressed scanner values against the manual measurement values as per the ISO 20685:2005 and ISO 8559:1989 were done for all the 102 dimensions. Please refer to table 1 for the testing on error limits for some of the dimensions.
From table 1 it can be learned that the regressed measurement values were observed as Pass (P) to most of the dimensions, however, for two of the dimension (1. Inside leg-length, and 2. Across shoulder) the upper limit was marginally out for Inside leg-length for ISO 20685:2015, and Across shoulder for ISO 8559:1989 standard error limits.
The scanners were observed as highly consistent and the same was statisti- cally confirmed by determining the intra-class correlation (ICC) values. ICC is used to check for the consistency and repeatability between different scan measurements and it represented the variance attributable to error (Koepke et al., 2017), (Koo & Li, 2016). ICC reflects both degrees of correlation and
174 Tiwari and Anand
Table 1. Scanner validation (regressed scanner measurement vs. manual measurements).
Outcome* P P F# P P P P P P Acceptable Error Based on ISO 8559:1989, % values (cm) Outcome P P P P F# P P P P
*P: Pass, F: Fail, F#: Failed at one limit
agreement between measurements. Values less than 0.5 are indicative of poor reliability, values between 0.5 and 0.75 indicate moderate reliability, values between 0.75 and 0.9 indicate good reliability and values greater than 0.90 indicate excellent reliability (Kouchi & Mochimaru, 2011). While measuring the same subject multiple times in the same scanner the ICC values for all the dimensions were observed excellent ranging between 0.865 and 0.999.
There have been several research works confirming deviations between the scanner extracted measurements and the manual measurements. In most of the researches it is observed that that scanner measurements were generally larger than manual measurements with that the mean differences of circum- ferences being larger than those of lengths and heights (Han et al., 2010), (Mckinnon & Istook, 2001), (Gordon et al., 2012), (Koepke et al., 2017), (Simenko & Cuk, 2016). As far as the application of regression modeling is concerned, there has been limited research reported in the special context of scanner validation and reliability. Han et al. 2010 conducted a comparative analysis of 3D body scan measurements and manual measurements of south Korean adult females and estimated some of the scanner dimensions (such as chest circumference, under-bust circumference, and arm length) using regres- sion equations. Further, the researchers advocated the use of regression-based estimation equations in compensating for the drawbacks of 3D scanning and aiding in the practical application of scanner measurements (Han et al., 2010). This application of regression equations as applied by Han et al. 2010 in estimating corrected or adjusted scanner measurements has been reported by Gordon et al. 2012 as well (Gordon et al., 2012).
RESULTS AND DISCUSSION
As confirmed by several works done in the area of 3D body scanning, this research also confirmed that the Sizestream SS14 3D body scanners were
Validation and Reliability of Sizestream 3D Scanner Using Regression Modeling 175
highly consistent, however, some deviations between scanner measurement to the manual measurements (used as a gold standard to check errors in 3D scanning) were witnessed throughout the process. Such variations failed most of the measurements in terms of accuracy levels (as per ISO 8559:1989 and ISO 20685:2005). In such a situation, the application of regression modeling-based equations to predict the regressed scanner values as adju- sted measurement values was observed as more accurate while testing as per ISO 8559:1989 and ISO 20685:2005 standard protocols.
Here it is worth mentioning that for most of the dimensions (while estima- ting the regressed scanner values) R2 value was observed as excellent (above 0.9), however for some of the dimensions (such as calf height, neck point to waist-CBL, upper arm length, and lower arm length) R2 value was observed as poor (below 0.6) and the scatter plot didn’t reflect a clear pattern. Despite that such dimensions (indicating poor R2 value) were observed as Pass as per the acceptable error limits of ISO 8559:1989 and ISO 20685:2005 standard protocols. The researchers believe that this behavior is an area of further investigation.
CONCLUSIONS AND FUTURE SCOPE This paper discussed a step-by-step regression modeling-based methodology for validation and reliability of the Sizestream 3D body scanners. Frequent deviations between the scanner extracted measurement values and manual measurement values were observed, though scanners were witnessed as highly consistent. A regression equation-based approach was applied to estimate the regressed measurement values to all other SS 14 body scanners. The application of regression modeling (to predict the adjusted scanner values) confirmed the scanner measurements within the permissible error limits of ISO 20685:2005 and ISO 8559:1989. The 3D scanner validation methodo- logy discussed in this paper may be applied successfully in future research related to 3D scanning recommended for conducting sizing surveys.
ACKNOWLEDGMENT
The authors would like to acknowledge the valuable contributions from Prof. Vandana Narang, Prof. Suhail Anwar, Prof. Monika Gupta, Prof. S.S. Ray and Prof. Ananya Deb Roy of the National Institute of Fashion Technology, India for their technical inputs to carry out this research. We are also highly thankful to the participants for their volunteer contribution as subjects for 3D scanning in this study.
REFERENCES
Gordon, C. C. et al. (2010) 2012 Anthropometric survey of U.S. Army personnel: methods and summary statistics. Available at: https://dacowits.defense.gov/L inkClick.aspx?fileticket=EbsKcm6A10U%3D&portalid=48 (Accessed: February 28, 2022).
176 Tiwari and Anand
Han, H., Nam, Y. and Choi, K. (2010) “Comparative analysis of 3D body scan measurements and manual measurements of size Korea adult fema- les,” International journal of industrial ergonomics, 40(5), pp. 530–540. doi: 10.1016/j.ergon.2010.06.002. ISO 8559:1989 (1989). Garment construction and anthropometric surveys – Body
dimensions. ISO Standard. Geneva: International Organization for Standardiza- tion International Organization for Standardization. ISO 20685: 2005 (2005). 3D scanning methodologies for internationally compatible anthropometric databases. ISO Standard. Geneva: ISO International Standard Organisation. ISO 20685: (2015). 3D scanning method for internationally compatible anthropo-
metric databases. ISO Standard. Geneva: International Standard Organisation. Koepke, N. et al. (2017) “Comparison of 3D laser-based photonic scans and manual anthropometric measurements of body size and shape in a validation study of 123 young Swiss men,” PeerJ, 5(e2980), p. e2980. doi: 10.7717/peerj.2980. Koo, T. K. and Li, M. Y. (2016) “A guideline of selecting and reporting intraclass
correlation coefficients for reliability research,” Journal of chiropractic medicine, 15(2), pp. 155–163. doi: 10.1016/j.jcm.2016.02.012. Kouchi, M. (2014) “Anthropometric methods for apparel design: body measurement devices and techniques,” in Gupta, D. and Zakaria, N. (eds.) Anthropometry, Apparel Sizing and Design. Elsevier, pp. 67–94. Kouchi, M. and Mochimaru, M. (2011) “Errors in landmarking and the evaluation
of the accuracy of traditional and 3D anthropometry,”Applied Ergonomics, 42(3), pp. 518–527. doi: 10.1016/j.apergo.2010.09.011. Mckinnon, L. and Istook, C. (no date) “Comparative analysis of the Image Twin system and the 3t6 body scanner.” Available at: http://www.ergo- eg.com/uploads/digi_lib/38.pdf (Accessed: February 28, 2022). Simenko, J. and Cuk, I. (2016) “Reliability and validity of NX-16 3D body scan-
ner,” Revista Internacional de Morfologia [International journal of morphology], 34(4), pp. 1506–1514. doi: 10.4067/s0717-95022016000400053. Tiwari, M. and Anand, N. (2021) “Validation and reliability of sizestream 3D scanner for human body measurement,” in Functional Textiles and Clothing 2020. Singapore: Springer Singapore, pp. 13–23.
LISTED IN THE AHFE DIGITAL BOOKSTORE CATALOGUE
Explore the complete digital volume
Human Factors for Apparel and Textile Engineering
Read this individual research paper free through the original publisher, or explore the full digital proceedings book.
ISBN 978-1-958651-08-7
Explore this ISBN in the AHFE Bookstore ↗Listed in the July 2026 bookstore catalogue; search by ISBN to confirm current availability · Digital book purchase optional