Sunwoong Kim (2024). Perceived comfort prediction by occupant package layout and vehicle seat engineering factors. In: Advances in Human Factors of Transportation. AHFE Open Access, vol. 148, pp. 591–597. https://doi.org/10.54941/ahfe1005250
Perceived comfort is one of the most important factors in automotive engineering, but it is also a very complex and difficult to define. Consumer survey and expert evaluation is the mostly used to determine the subjective comfort level. As tech-nology advances, engineering becomes increasingly important during the design review phase.The aim of this study is to define a conceptual framework of the consumers’ per-ceived comfort, which is related to various engineering factors, and to develop a ML-model (Machine Learning model).Totally, 23 variables were determined by various objective measured data from vehicle and vehicle seat as independent variables. Each variable was defined through data conversion and calculation after measuring the physical properties and the geometric characteristics of the vehicle seat, and the characteristics of the sitting package. Totally, 11 variables were defined by various subjective evalua-tion data as dependent variables.Sedans and SUVs from various segments were included in the dataset for devel-opment of the machine learning model.Postscript.This paper is a follow-up study for my previous paper which published by AHFE2023, paper no. 326.Developing the machine learning model is almost developed, however, requires little bit more time. The estimated date of the finish is around end of this year. Current model has over 0.8 of r-square values, but we try to various methods to develop the optimal prediction model. In some cases, it is possible to use several different methods to each engineering purpose. The final result will be included in this paper.
Past studies have been interested in finding, clarifying, and defining the rela- tionship between objective measures from vehicle seat itself and subjective measures from consumer. Body pressure distribution is the mostly considered objective measures. Because the body pressure is well reflected and interacted tools between vehicle seats and human body/posture (Naddeo et al., 2018; Zhongliang et al., 2009; Kolich & Taboun, 2004; Wegner et al., 2020).
work to determine and predict the comfort level with OSCAR and/or their own human dummy.
Another research trend in vehicle (seat) comfort is CAE-based comfort engineering through the development of the Human body modelling. Simulat- ing and evaluating the comfort level using the provided human body model is one important trend for comfort engineering and research. It mostly focused finding the mechanical properties of the seat and prove occupant posture and their sitting location. Developing a finite element human body model is, also, the major roots of CAE-based comfort research (Ile et al., 2014; Choi et al., 2006). The majority of vehicle-level seat comfort research concerns vibration ride comfort. SEAT index is mainly used to define the level of vehicle ride comfort quality under driving condition (Jang, 2005; Aniruddha, 2019).
However, due to the complexity of the comfort itself, it was difficult mat- ters that defining and determining the level of the (vehicle) seat comfort. This is why many researchers and engineers rely on subjective surveys. There is a problem with evaluations that rely on human emotions because they can- not guarantee accuracy and requires large number of participants. Recently, research has been conducted on algorithms that define and explain overall comfort levels. It suggested well-defined conceptual frame which all included vehicle, seat itself, and occupant. And conducted to predict comfort levels using these factors (Mike, 2008; Sunwoong, 2023).
The aim of this research is to define a conceptual framework of the con- sumers’ perceived comfort, which is related to various engineering factors, and to develop a ML-model.
METHOD
Overall comfort levels were affected by both psychological and physical fac- tors. However, it is difficult to define and/or explain with mathematical functions to psychological factors. It was performed that defining the con- ceptual framework of the consumers’ perceived comfort level from various physical factors like as seat aspects, vehicle environment, and interaction between occupants and seat.
Based on this conceptual framework, it was conducted that a developing the database structure and gathering the dataset.
From a seat mechanical properties aspect, seat mechanical properties were gathered from 8 mechanical test methods – initial and long-term SLD (Static Load Deflection), HSLD (Head restraints SLD tests), HP (Hardness Pro- file), LSP (Long-term Sitting Properties), Impact Damping Tests, Vibration Transmissibility, and SBC (Seat Back Compliance) as well.
Data which can describe occupants package layout was gathered through Benchmark SgRP process (SAE J3103), from a vehicle environment aspect.
General seat dimensions and interacted dimensions between SAE J826 and STO (Seat Trim Outline) dataset was gathered by SAE J2732 and our internal procedure, as interaction with dummy/human aspects.
Sedans and SUVs from various segments were included in the dataset for development of the machine learning model.
Perceived Comfort Prediction by Occupants Package Layout 593
Four methods were considered to develop the ML model: Linear regres- sion, Ridge regression, Elastice Net, and Lasso. However, finally, the Lasso model was removed due to the quite lowered R-squared value of the Lasso model.
RESULTS
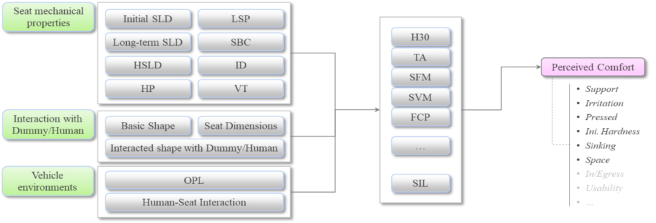
At first, 23 factors were converted and calculated from 13 major test methods from 3 major comfort aspects. Generally used values from each method and some internal specific values were used to determine the 23 factors. Finally, the 11 major factors survived after statistical analysis. The consumers’ per- ceived comfort is predicted by these 13 major factors. These are illustrated below Figure 1. Where the CI (Comfort Index) value, perceived comfort, is overall values for each comfort from a perceived comfort aspects like as feeling of support, irritation, pressed, firmness, sinking, and so forth.
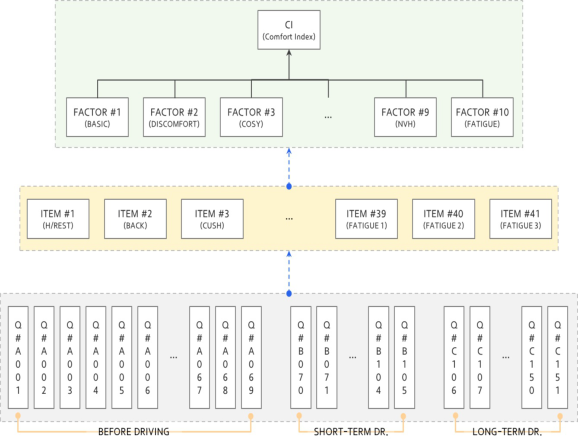
Figure 1: Conceptual framework from objective dataset to perceived comfort.Figure 2: Basic conceptual framework to calculate a CI index by consumers’ subjective response (Sunwoong, 2023).
594 Kim
Figure 2 showed that the basic conceptual model to calculate CI of a vehicle seat from subjective response. At first, the evaluated value for 41 items were calculated by 151 subjective responses. Finally, an overall comfort index was calculated by scores of these 41 items.
Factors USIC USIB ALS SIS SIL - VIF 7.78 7.26 3.11 4.32 5.56 -
1)VIF : Variance Inflation Factor
Linear correlations between all independent variables were confirmed, and factors with high linear correlations between independent variables were first removed.
H30 and other 10 factors were survived after iteration field from develop- ing the ML model and checking the validity for all three ML methods.
As shown in Table 1, all the survived factors have no problem with multicollinearity by calculating the VIF.
Developed three ML models showed relatively high R-squared value, 0.623 ∼0.651. And, showed relatively low root mean square errors from 0.132 to 0.374 (Table 2). All three models developed were found to have similar predictive performance.
Table 2. R-square value and RMSE (root mean squared error) of developed ML model.
Table available in the original PDF paper.
Factors Linear Regression Ridge Regression Elastice Net R-square 0.651 0.628 0.623 RMSE 0.374 0.132 0.389
DISCUSSION AND CONCLUSION It was suggested that the predicting the comfort score by occupant package layout and vehicle seat engineering factors, and the predictive model showed quite good performance (Kim, 2023).
In this study, it attempted to develop a machine learning model using a wider range of factors. All three developed ML model showed the good validation of R-square values and RMSE.
As a result of analysis of the coefficient values, it was confirmed that the sinking factor had a much lower impact on the CI than other factors.
H30, USIC, ALS were the highest impact factors to CI for negative direction.
One result is that the influence of sinking factors was found to be very low. The amount of change in the data itself may have been small, but since the sinking factor is a factor that is perceived through relatively long-term
Perceived Comfort Prediction by Occupants Package Layout 595
driving, it may have been difficult for passengers to distinguish the differences in sinking amount.
H30 is one of the highest impact factors to CI for negative direction. This means that as the H30 value increases, the seating position also higher accord- ingly. The recommended joint angle is that the least discomfort was within a neutral range for the tissue stresses are minimized (Keegan, 1953; Reed, 2000). The higher sitting position can lead to further than a neutral range of trunk-thigh angle.
Occupants prefer to more uniformly support on the seat cushion, feeling of seat cushion and back padding. Occupant seems to prefer feeling properly supported by a seat cushion rather than feeling elasticity when sitting.
Table 3. Comparison of the coefficient’s values of developed ML model.
HSLD – Head restraint SLD test HP – Hardness Profile LSP – Long-term Sitting Properties ID – Impact Damping tests VT – Vibration Transmissibility SBC – Seat Back Compliance STO – Seat Trim Outline H30 -Vertical distance between heel point and SgRP SVM – Amount of Seat Vertical Movement FCP – Feeling of seat Cushion Padding FBP – Feeling of seat Back Padding HLRC – Hysteresis Loss Ratio of seat Cushion HLRB – Hysteresis Loss Ratio of seat Back USIC – Uniform Support Index of seat Cushion USIB – Uniform support Index of seat Back ALS – Area of Lumbar Support SIS – Sinking Index during Short-term driving. SIL – Sinking Index during Long-term driving.
596 Kim
REFERENCES
Aniruddaha Deouskar, A comparative study to assess the effect and cause of ride quality and comfort of passenger vehicle with subjective correlation, (2019), SAE technical paper 2019-28-2410, doi: 10.4271/2019-28-2410. Chuan Zhao, Sui-huai Yu, Charles Miller, Moin Ghulam, Wen-hua Li, Lei Wang,
(2018) Predicting aircraft seat comfort using an artificial neural network, Human Factors and Ergonomics in Manufacturing & Service Industries, Vol. 29, Issue 2, 154–162, doi: 10.1002/hfm.20767. Choi, H., Sah, S., Na, S., Montmayeur, K. et al., “Human Body Modeling for Virtual Seat Comfort Testing,” SAE Technical Paper 2006-01-2335, 2006, doi: 10.4271/2006-01-2335. Dolan, P. Adams, M., Mutton, W. C., (1988), Commonly adopted postures and their
effect on the lumbar spine, Spine, 13(2), pp. 197–201. H. K Jang, Design guideline for the improvement of dynamic comfort of a vehicle seat and its application, (2005), International Journal of Automotive Technology, Vol. 6, No. 4, pp 383–390. Ile Mircheski, Tatjana kandikjan, Sofija Sidorenko, Comfort analysis of vehi-
cle driver’s seat through simulation of the sitting process, Tehniˇcki vjesnik 21, 2(2014), 291–298 Mike Kolich, (2008). A conceptual framework proposed to formalize the scientific investigation of automobile seat comfort, Applied Ergonomics, 39, 15–27. Mike Kolich & SM Taboun, (2004), Ergonomics modelling and eval- uation of automobile seat comfort, Ergonomics, 47:8, 841–863, doi: 10.1080/0014013042000193273. M. Wegner, R. Martic, M. Franz, P. Vink, (2020), A system to measure seat-human
interaction parameters which might be comfort relevant, Applied Ergonomics, Volume 84, 103008, issn 0003–6870, doi: 10.1016/j.apergo.2019.103008. Naddeo, A., Califano, R. & Vink, P. The effect of posture, pressure and load distribution on (dis) comfort perceived by students seated on school chairs. Int J Interact Des Manuf 12, 1179–1188 (2018). https://doi.org/10.1007/s12008-018-0479-3 Naseem Ahmadpour, Gitte Lindgaard, Jean-Marc Robert & Bernard Pow- nall (2014): The thematic structure of passenger comfort experience and its relationship to the context features in the aircraft cabin, Ergonomics, doi: 10.1080/00140139.2014.899632. Sunwoong Kim. (2023). Predictive Validity of the Vehicle Seat Comfort Score by
Using the Seat Design and Testing Factors. In: Gesa Praetorius, Charlott Sellberg and Riccardo Patriarca (eds) Human Factors in Transportation. AHFE (2023) International Conference. AHFE Open Access, vol. 95. AHFE International, USA. Sunwoong Kim, YM Kim, YH Kim, WM Pa, (2019). Measurement of an Occupant’s Lateral Motion by Using the Inertial Measurement Unit. In: Stanton, N. (eds) Advances in Human Aspects of Transportation. AHFE 2018. Advances in Intelligent Systems and Computing, vol. 786. Springer, Cham. https://doi.org/10. 1007/978-3-319-93885-1_72. Suzanne Hiemstra-van Mastrigt, Liesbeth Groenesteijn, Peter Vink, Lottie F. M.
Kuijt-Evers, (2017). Predicing passenger seat comfort and discomfort on the basis of human, context and seat characteristics: a literature review, Ergonomics, 60:7, 889–911, doi: 10.1080/00140139.2016.1233356. Xuguang Wang, Michelle Cardoso, Georges Beurier, (2018), Effects of seat parameters and sitters’ anthropometric dimensions on seat profile and optimal compressed seat pan surface, Applied Ergonomics, Volume 73, Pages 13–21, doi: 10.1016/j.apergo.2018.05.015.
Perceived Comfort Prediction by Occupants Package Layout 597
Yang Zhonglian, Sun Shouqian, Gao Zenggui, Chen Yumiao, (2010). Correlation Model of Overall and local Sitting Comfort based on Rating Scales, 2010 IEEE 11th International Conference on Computer-Aided Industrial Design & Conceptual Design 1, doi: 10.1109/CAIDCD.2010.5681272. Zhongliang Yang, Shouqian Sun and Guodong Chen, “Evaluating sitting comfort with questionnaire and body pressure distribution: Overview and design,” 2009 IEEE 10th International Conference on Computer-Aided Industrial Design & Conceptual Design, Wenzho, 2009, pp. 1443–1447, doi: 10.1109/CAIDCD.2009.5375350.
LISTED IN THE AHFE DIGITAL BOOKSTORE CATALOGUE
Explore the complete digital volume
Advances in Human Factors of Transportation
Read this individual research paper free through the original publisher, or explore the full digital proceedings book.
ISBN 978-1-964867-24-3
Explore this ISBN in the AHFE Bookstore ↗Listed in the July 2026 bookstore catalogue; search by ISBN to confirm current availability · Digital book purchase optional