Noeru Masuda, Toma Uda, Yuta Hosaka, Haruna Korenaga, Hiroo Fujiwara, Mitsuko Ogaki, Mizuki Nakajima (2026). The Effect of Paperboard Packaging Impression on Purchase Intentions for Chocolate. In: Interdisciplinary Practice in Industrial Design. AHFE Open Access, vol. 222, pp. 56–67. https://doi.org/10.54941/ahfe1007746
Boxed confectionery products are often purchased on the spot in everyday settings, and packaging serves as an important cue for product understanding and impression formation. However, it remains unclear how differences in the dimensions and proportions of simple rectangular boxes relate to impression formation and purchase intention. Therefore, this study examined the effects of box shape on impression formation and purchase intention for self-consumption, focusing on paper box packaging for chocolate products. Fifty-four men and women in their twenties were presented with shelf-display photographs of nine uniformly white samples and asked to rate seven impression words, based on the consumer behavior process, on a 7-point scale. Principal component analysis was applied to create impression spaces by gender and purchase frequency. The results showed that the evaluation process could be organized into stages corresponding to attention acquisition, meaning-making, emotional response, and context fit. Greater information search was associated with the use of a wider range of cues, making evaluations more likely to integrate meaning-making with emotional response. Greater purchase experience also made it easier to connect appearance characteristics with judgments of involvement attitudes, such as whether the product seemed everyday or special, making context-fit evaluations more prominent. Within the impression space, products were mainly segmented by volume and frontal surface area, and clusters shifted according to consumer attributes, even for identical boxes. Although no significant differences in final purchase intention were found across attributes, purchase intention tended to increase when evaluations related to eye-catching appeal were relatively lower.
Boxed confectionery products are relatively inexpensive products that are frequently purchased on a daily basis; rather than being bought after detailed prior comparison, they are often selected on the spot while browsing the store shelves. Furthermore, since it is difficult to directly inspect the contents of boxed products, consumers are believed to rely on the packaging to
The Effect of Paperboard Packaging Impression on Purchase Intentions for Chocolate 57 perceive the product, form an impression, and narrow down their choices as they make a decision. The impressions formed at this stage go beyond mere visual preferences; they function as evaluations related to the consumer’s understanding and positioning of the product—such as perceived quality, perceived luxury, intended use, and suitability for specific occasions—and may influence purchasing decisions. Furthermore, prior research has shown that not only graphic elements such as photographs and colors, but also the package shape itself influences consumer expectations and evaluations (Ares and Deliza, 2010). However, much of the existing research has focused on packages with shape characteristics that are relatively easy to interpret, such as roundness or angularity, and it remains unclear whether differences in the dimensional composition and proportions of simple rectangular boxes themselves evoke specific impressions in consumers. Furthermore, there are few studies that have examined how such impressions influence purchasing decisions through evaluations related to product understanding and positioning. Therefore, this study aims to explore the impressions formed by consumers regarding chocolate paper box packaging—even though the box shapes are relatively common and do not stand out on store shelves—and to clarify how these impressions relate to purchase intention.
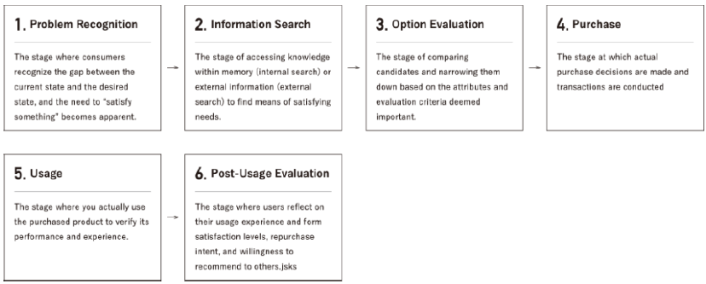
Consumer Decision Process Purchase intention is formed during the decision-making process leading to purchase, including narrowing down candidates and integrating evaluations. Therefore, this study organizes evaluations based on the consumer behavior process framework to consistently capture the effect of shape on purchase intention. Sunaga et al. (2008) noted in previous research that the consumer behavior process commonly includes stages such as “problem recognition,” “information search,” “alternative evaluation,” “purchase,” “use,” and “post- use evaluation” (Figure 1).
Figure 1: Organization of the consumer behavior process by Sunaga et al. (Sunaga & Onzo, 2008).
For relatively inexpensive, everyday items such as chocolate products, purchases are more likely to originate from vague desires such as “I feel like something sweet” or “I want a change of pace,” rather than from a clear problem recognition. Therefore, this study excludes the problem- recognition stage from the consumer behavior process. For similar reasons, proactive external information search beforehand was not assumed. Instead, a distinction was made between everyday information exposure through advertising and SNS, and in-store information search using cues such as shelf displays, POP, ingredient labels, and logos, treating these as “everyday information gathering” and “in-store information gathering,” respectively. Furthermore, as this study focuses on actions leading up to purchase, the usage and post-usage evaluation stages were also excluded. Figure 2 shows the consumer process for chocolate products based on the consumer behavior process used in this study.
Figure 2: Consumer behavior process for chocolate products in this study.
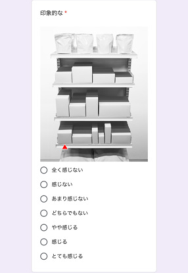
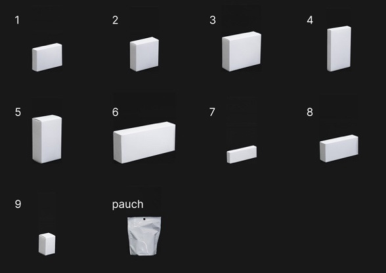
Experiment on Impressions and Purchase Intentions Regarding Chocolate Product Boxes Displayed in Stores Gender differences exist in consumer information search levels, with women generally tending to search more extensively and utilize a wider variety of information sources than men (Hawkins et al., 2004). Furthermore, it has been noted that younger, more highly educated consumers actively engage in information search, enjoying the shopping and knowledge acquisition process itself (Hawkins et al., 2004). Therefore, this study conducted a questionnaire survey targeting fifty-four men and women in their twenties, who are considered to have relatively active information-seeking behavior, to clarify impression evaluations and impression relationships regarding chocolate product boxes displayed in stores. To focus solely on shape, graphic elements were excluded from the boxes, and all boxes were standardized to white. These boxes were displayed on store shelves simulating an actual sales floor, and photographs were taken. The questionnaire screen is shown in Figure 3, and the boxes used and box numbers are shown in Figure 4.
Participants were asked to specify a box from the photographs and rate their visual impressions of it (“Impressive,” “Eye-catching,” “Refined,” “Simple”) and the emotions evoked by the box (“Expectant,” “Familiar,” “Attractive”) on a 7-point Likert scale (strongly feel – neither feel nor not feel – strongly do not feel). The participants were also asked about their purchase frequency of chocolate products and whether they would buy them for themselves.
Figure 3: Example of the google form questionnaire screen for rating “Impressive” on a 7-point scale.Figure 4: Boxes and box numbers (pouch size: 140 mm × 100 mm × 50 mm).
RESULTS
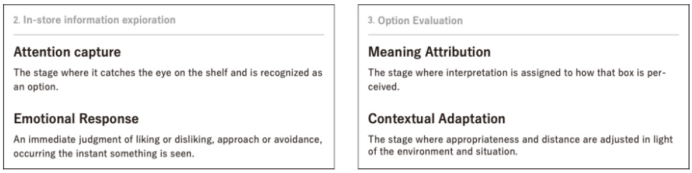
To clarify the differences in impression structures and box impression relationships based on gender and purchase frequency, the mean values for each evaluation term regarding the boxes were calculated per attribute, followed by principal component analysis. Purchase frequency was categorized into three groups: high frequency (two to three times per week, once per week), medium frequency (once per month), and low frequency (once every six months, once per year, and no purchase within the last year). For each attribute, the average value of each evaluative term regarding the boxes was calculated and used. The principal components were extracted based on a cumulative contribution rate of 70% and an eigenvalue of 1 or greater. The first and second principal components were interpreted for all attributes. The interpretation of the principal components revealed a structure comprising the following stages: Attention Acquisition, Emotional Response, Meaning Attribution, and Contextual Fit. Consequently, the consumer behavior process for chocolate products was redefined, as shown in Figure 5. However, the impressions and progress corresponding to each stage varied by attribute, as described below.
Figure 5: Consumer behavior process for chocolate products redefined based on results.
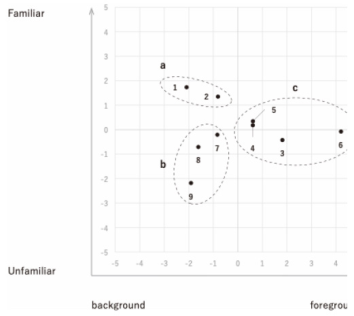
Comparison of Impression Structures and Evaluation Processes by Gender In the principal component analysis for women, Principal Component 1 (eigenvalue = 4.210, contribution rate = 60.139%) and Principal Component 2 (eigenvalue = 1.308, contribution rate = 18.685%) were adopted (Table 1), with a cumulative contribution rate of 78.823%. For both genders, factor loadings with absolute values of 0.8 or higher were considered for interpretation. Principal Component 1 showed high positive loadings for “Eye-catching,” “Impressive,” and “Expectant,” while “Simple” showed a high negative loading. Therefore, it was interpreted as representing the axis of prominence (foregrounding–backgrounding), indicating whether an item draws attention and appears to stand out on the shelf or blends into the surroundings and recedes. Principal Component 2 showed a high positive loading for “Familiar,” establishing it as an axis representing the degree of familiarity. These results suggest that, for women, attention may be directed more toward the relative positioning of the box on the shelf than toward solely evaluating the intensity of the stimulus itself. Furthermore, the extraction of “Familiar” as an independent axis indicates that after attention is drawn, women may evaluate whether the box can be incorporated into their life context or accepted.
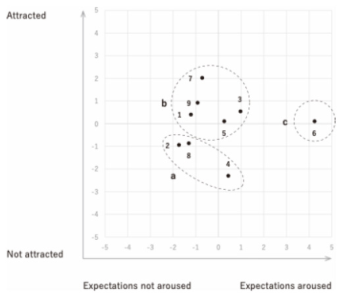
Next, in the principal component analysis for men, Principal Component 1 (eigenvalue = 3.339, contribution rate = 47.705%) and Principal Component 2 (eigenvalue = 1.545, contribution rate = 22.068%) were adopted (Table 1), with a cumulative contribution rate of 69.772%. Adding the third principal component increased the cumulative contribution rate to 86.762%; however, interpretation based on two components was judged to be appropriate, as including the third and subsequent components could complicate the interpretation. Principal Component 1 showed high positive loadings on “Eye-catching,” “Expectant,” and “Impressive.” Therefore, it was defined as an axis representing expectation arousal—whether the box stirred anticipation or left an impression. Furthermore, since Principal Component 2 showed a high positive loading on “Attractive,” it was designated as an axis representing the degree of attraction. These results suggest that men tend to form impressions based on the eye-catching features of boxes. Additionally, the emergence of “Attractive” as an independent principal component
The Effect of Paperboard Packaging Impression on Purchase Intentions for Chocolate 61 indicates that emotional responses tend to be relatively prominent within the evaluation structure.
Principal Component 1 0.163 0.1 0.428 −0.192 0.017 0.978 −0.307 Principal Component 2
Men 0.915 0.974 −0.507 −0.346 −0.346 −0.014 0.474 Principal Component 1
0.024 −0.048 0.618 0.673 0.673 0.115 0.81
Principal Component 2 Next, regarding cluster characteristics, among women, clusters were broadly divided into foreground and background categories based primarily on volume differences (Table 2, Figure 6). Furthermore, background clusters were subdivided into familiar and unfamiliar categories. This suggests that among women, candidates are first organized into foreground and background based on their relative position on the shelf. Even when background boxes were not discarded, comparisons proceeded using evaluations related to acceptability as a guide.
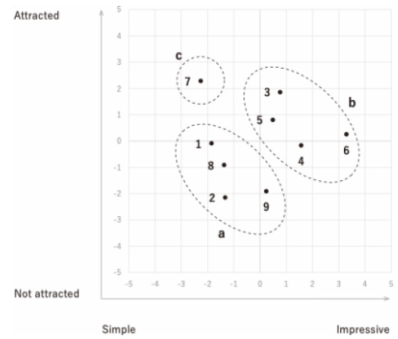
For men, clusters were primarily separated into appealing and unappealing categories based on volume differences (Table 2, Figure 7). Using a cluster with a moderate volume as the baseline (cluster a), items deviating significantly from this baseline (smaller or larger than the baseline) were grouped into cluster b and showed a tendency to be appealing. This suggests that deviation from the baseline may attract attention and alter impressions, thereby increasing “appeal.” Furthermore, considering men’s relatively lower information-seeking tendencies, they may be more inclined to quickly estimate value based on easily discernible cues, such as volume. Thus, larger boxes likely triggered value estimations such as “more quantity,” “good deal,” or “higher satisfaction,” potentially increasing “attraction.” Conversely, smaller boxes may have suggested “easier to buy,” “easier to try,” or “less likely to fail,” potentially boosting their appeal in a similar manner.
Figure 6: Scatter plot and clustering (women).Figure 7: Scatter plot and clustering (men).
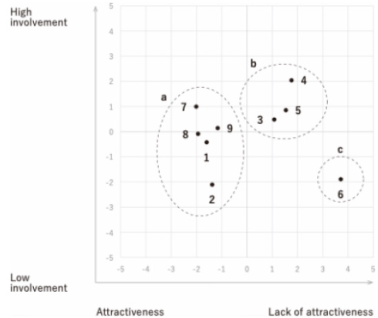
Comparison of Impression Structures and Evaluation Processes by Frequency Principal component analysis for the high-frequency group adopted Principal Component 1 (eigenvalue = 4.252, contribution rate = 60.739%) and Principal Component 2 (eigenvalue = 1.790, contribution rate = 25.571%), with a cumulative contribution rate of 86.310% (Table 3). For all frequency groups, factor loadings with absolute values of 0.9 or higher were considered for interpretation. Principal Component 1 showed high positive loadings for “Attractive,” “Eye-catching,” “Impressive,” and “Expectant.” Therefore, Principal Component 1 was defined as an axis representing attractiveness, where emotional responses (attraction) occur simultaneously with foregrounding. Principal Component 2 showed a high positive loading for “Refined” and a high negative loading for “Familiarity.” Thus, it was defined as an axis representing involvement attitude (high involvement– low involvement), indicating whether chocolate is treated with special care or handled casually in daily life. These results suggest that, for the high- frequency group, cues derived from appearance directly influence favorability judgments, and the process from noticing to being “attracted” tends to be integrated. Furthermore, involvement attitude likely influences contextual judgments regarding consumption settings and handling methods.
The Effect of Paperboard Packaging Impression on Purchase Intentions for Chocolate 63 Next, in the principal component analysis for the medium-frequency group, Principal Component 1 (eigenvalue = 2.883, contribution rate = 41.188%) and Principal Component 2 (eigenvalue = 1.741, contribution rate = 24.870%) were adopted, with a cumulative contribution rate of 66.058%(Table 3). The addition of a third principal component increased the cumulative contribution rate to 86.762%. However, as this risked complicating the interpretation, it was determined that interpretation based on the first two components was appropriate, excluding the third and subsequent components. Principal Component 1 loaded strongly on “Striking,” while Principal Component 2 loaded strongly on “Attractive,” making them suitable axes representing the strength of each evaluation term. These results indicate that, in the medium- frequency group, “catching the eye” and “being attracted” do not necessarily coalesce into the same evaluation; instead, the ease of directing attention and the judgment of favorability may be separated and organized independently.
Furthermore, in the principal component analysis for the low-frequency group, Principal Component 1 (eigenvalue = 3.161, contribution rate = 45.159%) and Principal Component 2 (eigenvalue = 2.314, contribution rate = 33.063%) were adopted, with a cumulative contribution rate of 78.222%. Principal Component 1 showed a high positive loading for “Impressive” and a high negative loading for “Simple.” Therefore, it was designated as the axis representing the box’s distinctiveness. Furthermore, Principal Component 2 showed a high positive loading for “Attractive,” so it was designated as an axis representing the degree of attraction. These results suggest that, in the low-frequency group, the box is first organized based on whether it is distinctive and then evaluated for its attractiveness.
Table 3: Principal component loadings matrix.
Table available in the original PDF paper.
Impressive Striking Refined Simple Infectant Familiarity Attractive High Frequency
0.928 0.943 –0.077 –0.866 0.901 –0.157 0.952
Principal Component 1 –0.108 -0.204 0.911 0.084 0.206 –0.919 0.112 Principal Component 2
Medium Frequency 0.867 0.926 –0.47 -0.519 0.83 0.109 0.287 Principal Component 1
0.284 –0.177 0.832 0.185 0.186 –0.134 0.922
Principal Component 2 Low Frequency
0.955 0.764 –0.571 –0.941 0.512 –0.396 –0.188
Principal Component 1
0.061 0.484 0.491 0.108 0.755 0.665 0.901
Principal Component 2
Next, regarding cluster characteristics, while high-frequency clusters were divided based on Principal Component 1, focusing on Principal Component 2 revealed that boxes in which one of the three sides was distinctive tended to belong to the high-involvement cluster (Table 4, Figure 8). These boxes are likely to be perceived by the high-frequency group as exceptions that deviate from their “usual go-to purchases,” evoking a sense of nonroutine or premium quality.
In the medium-frequency group, there was a tendency to be attracted to boxes with smaller front surface areas rather than to those with larger ones (Table 4, Figure 9). This suggests that boxes with smaller front surface areas are recognized by the medium-frequency group as easier everyday choices, potentially leading to purchases because of the reduced perceived burden of quantity or price. Furthermore, the fact that a distinct group showed no attraction to boxes with large front surface areas suggests that a larger size may evoke perceptions of specialness or large quantity. This could lead to disinterest in everyday personal consumption because of perceived burden or limited use. While medium-frequency buyers have some experience, their choice of staple products is not fully automated; thus, they likely based their decisions on the easily understandable indicator of front surface area.
Furthermore, among low-frequency users, boxes with smaller front surface areas tended to be perceived as “plain and unappealing,” while those with larger front surface areas tended to be perceived as impressive and appealing (Table 4, Figure 10). These results suggest that among groups with limited purchase experience, plainness may be less likely to be positively associated with “reassurance” or “everyday use.” Moreover, this appears to reflect a simple evaluation structure in which the strength of the impression itself is more likely to lead directly to “attraction,” rather than a detailed evaluation that considers usage scenarios or perceived value.
Principal Component 1 –0.084 -2.148 1.859 –0.164 0.805 0.261 2.287 -0.908 –1.908 Principal Component 2
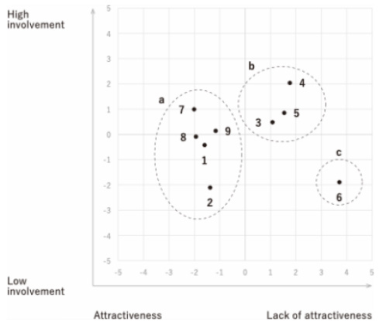
Figure 8: Scatter plot and clustering (high frequency).Figure 9: Scatter plot and clustering (medium frequency).Figure 10: Scatter plot and clustering (low frequency).
DISCUSSION
The stages of attention acquisition were primarily divided into either “organization encompassing both foregrounding and backgrounding” or “organization based on the strength of foregrounding,” differing depending on the attribute. An increase in information search volume adds more cues, leading to emotional responses in box evaluation and thereby increasing the weight of meaning-making in the evaluation process. Furthermore, the meaning-making stage was found to include judgment criteria such as “Can I incorporate this into my life?” and “Does it feel out of place?”, which consolidate the evaluation. Next, the more purchase experience a consumer has, the more likely they are to interpret appearance-related features in terms of involvement attitudes, such as “Is it easy to handle in daily life?” or “Is it something requiring special handling?”. Consequently, a tendency emerged to add a context-fitting stage to the evaluation process. This suggests that as purchase experience increases, accumulated past memories are referenced, leading to interpretations that go beyond mere appearance.
Regarding final purchase intention, no significant differences were observed across attributes. However, a common trend emerged: for self-consumption, boxes with relatively lower scores for “Eye-catching,” “Impressive,” and “Expectant” showed higher purchase intention compared to boxes with relatively higher scores for these attributes, and this tendency was particularly strong among high-frequency users. Packaging with relatively lower scores for “Eye-catching,” “Impressive,” and “Expectant” tended to elicit higher purchase intention than packaging with higher scores for these attributes, particularly among high-frequency purchasers. The level of “eye- catchingness” may not simply indicate good or bad but rather represent the “standardness” for that attribute. In terms of self-consumption, consumers tend to prioritize choices with a lower risk of failure. This suggests that packaging with low “eye-catchingness” that blends into the background— that is, standard products—is more likely to be selected, potentially leading to higher purchase intention.
CONCLUSION
The evaluation structure for paper box packaging varies by gender and purchase frequency, and it was found that the impression of the box differs owing to these influences. However, the grouping of evaluations may depend on the physical characteristics of the box. Furthermore, when consumers select products at the point of sale, they may evaluate impressions not only based on the box’s individual impression but also through relative comparisons based on its relationship with other boxes present in the sales area.
Therefore, it is crucial to consider packaging design based not only on the box’s individual impression but also on the other boxes on the shelf, taking into account the evaluation structure that varies according to the target attributes.
REFERENCES
Ares, G. and Deliza, R. (2010) ‘Studying the influence of package shape and colour on consumer expectations of milk desserts using word association and conjoint analysis’, Food Quality and Preference, 21(8), pp. 930–937. Hawkins, D. I., Best, R.J. and Coney, K.A. (2004) Consumer Behavior: Building
Marketing Strategy. 9th edn. Boston, MA: McGraw-Hill/Irwin. Sunaga, T. and Onzo, N. (2008) ‘The Consumers’ Sweet Spot and Their Satisfaction with the Purchase Process’, Journal of Marketing and Distribution, 11(1), pp. 3–19.
LISTED IN THE AHFE DIGITAL BOOKSTORE CATALOGUE
Explore the complete digital volume
Interdisciplinary Practice in Industrial Design
Read this individual research paper free through the original publisher, or explore the full digital proceedings book.
ISBN 978-1-964867-98-4
Explore this ISBN in the AHFE Bookstore ↗Listed in the July 2026 bookstore catalogue; search by ISBN to confirm current availability · Digital book purchase optional