Russell Marshall, Steve Summerskill, Sharon Cook (2020). The Digital Evaluation of Driver’s Field of View and its Potential Impact on Cyclist Safety. In: Advances in Applied Digital Human Modeling. AHFE Open Access, vol. 11. https://doi.org/10.54941/ahfe100415
Driver vision from vehicles is a long standing issue. One highly topical scenario includes accidents to vulnerable road users and in particular cyclists, from collisions with large goods vehicles (LGVs). In many of these cases driver vision is a potential causal factor in the occurrence of the accident. This paper presents research performed into the evaluation of driver vision, funded by the UK Department for Transport. To support the research, a 3D volumetric assessment technique was developed in the SAMMIE digital human modelling system. This highly visual technique provides an indication of the visible volumes of space around a vehicle and any blind spots. Vision was evaluated for a range of vehicle types from cars through to LGVs. To investigate the potential casual effects of vision in accidents and specifically those involving cyclists, scenarios were identified from UK Police accident data. These scenarios were then modelled and evaluated digitally. The results highlight that blind spots exist on many vehicles and for all driver sizes. Many of these blind spots can be countered by a change in posture of the driver. However, the most significant blind spot was found on Category N3 LGVs to the near-side of the vehicle. The research was also instrumental in a change to the EU Regulation 46 to remove the blind spot from future LGVs.
Driver vision from vehicles is a long standing issue and continues to be concern. One highly topical scenario includes injuries and fatalities to vulnerable road users (VRUs) and in particular cyclists, from collisions with large goods vehicles (LGVs) in urban areas. However, accident data show that serious injuries and fatalities continue to occur to VRUs from all types (Categories) of vehicle and from all types of manoeuvre. In many of these cases driver vision is a potential causal factor in the occurrence of the accident. Whilst driver vision is a priority for primary safety, the design of many vehicles ensures that there is likely to be some obstruction due to the solid structure of the vehicle occluding the driver’s view.
Regulations exist that specify the need for various field of view requirements for different vehicle Categories. A review of these regulations shows that the complexity of the situation has led to continuous amendment to regulations such as 2003/97/EC (2004) and UN Regulation 46 (2009) that deal with type approval of vehicles and minimum vision requirements. Yet, even with an almost continuous review process in place accidents continue to occur in which driver vision plays a role.
This paper presents research performed into the evaluation of driver vision, funded by the UK Department for Transport and from ongoing research performed with Cemex, a major UK operator of LGVs throughout the UK. To support the research a new 3D volumetric evaluation and assessment technique was developed in the SAMMIE digital human modelling system. This projection technique allows the visible volume that represents driver’s direct vision through window apertures, and driver’s indirect vision reflected through mirror surfaces to be modelled. This highly visual technique provides a clear indication of the visible volumes of space around a vehicle and conversely, any blind spots.
Road accidents involving cyclists is a highly topical problem. The UK has invested heavily in cycling infrastructure in recent years and has seen an increase in the number of journeys cycled and in the number of cyclists killed or seriously injured (RoSPA, 2012). In particular, issues surround accidents involving LGVs and cyclists have been explored over many years and initiatives by government and by industry have attempted to address the issues. However, accidents to cyclists still occur with a total of 118 fatalities in the UK in 2012. The majority of these accidents also occur in urban areas and London saw six cyclist fatalities within a two week period in November 2013.
To explore these issues, UK Police accident data was used to provide specific scenarios in which the impact of driver vision can be evaluated. These scenarios were modelled within the SAMMIE system and the volumetric projection technique used to explore the impact of blind spots and their potential contribution to accidents with VRUs and specifically cyclists.
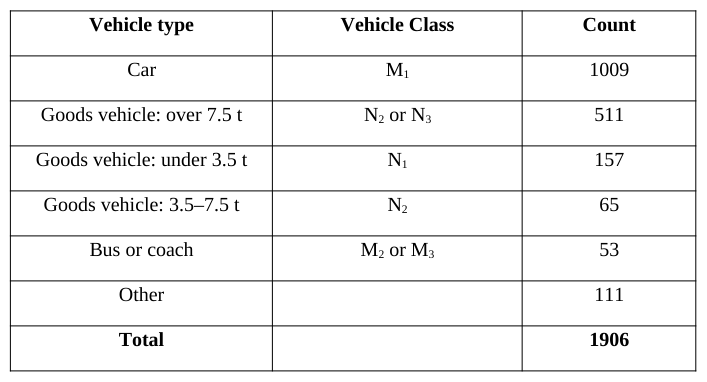
AN ANALYSIS OF UK ACCIDENT DATA To evaluate the nature and prevalence of accidents in which driver vision / ‘blind spot’ was recorded as a contributory factor in UK road accident data an analysis was made of two data sets. Using data available from the UK STATS 19 and ‘On the Spot’ (Hill and Cuerden, 2005) police accident databases a total of 1906 incidents were identified for the 2008 reporting period (Table 1).
Table 1: Vehicle types with ‘blind spot’ as contributing factor in UK road accident from STATS 19 (2008) Vehicle type Vehicle Class Count
A cluster analysis (Lenard et al, 2011) was applied to the data to explore: accident severity, vehicle type, vehicle movement, first point of contact, drive side and collision partner type (e.g. VRU, Motorcycle, Car etc.). From the cluster analysis a number of scenario types were identified that warranted further exploration. These include:
1. Articulated left-hand drive LGVs over 7.5 tonnes (N2 & N3 vehicles) changing lane to the right and Applied Digital Human Modeling & Simulation (2020) colliding with cars (25% all casualties, 14% of serious, 6% of fatal)
2. Articulated and Rigid right-hand drive LGVs over 7.5 tonnes (N2 & N3 vehicles) changing lane to the left and colliding with cars (24% of all casualties, 14% of serious, 6% of fatal)
3. Articulated and Rigid right-hand drive LGVs over 7.5 tonnes (N2 & N3 vehicles) changing lane to the right and colliding with cars (11% of all casualties, 2% of serious)
4. Goods vehicles (mostly small goods vehicles - N1) reversing into vulnerable road users and motorcycles (16% of all casualties, 29% of serious, 25% of fatal)
5. Non-articulated goods vehicles (all N Categories) moving directly forward into other road users, with over- representation of pedestrians, cyclists and motorcyclists (9% of all casualties, 18% of serious, 19% of fatal)
6. Articulated goods vehicles over 7.5 tonnes (N2 & N3 vehicles) also moving directly forward into other road users (VRUs and cars), (5% of all casualties, 4% of serious, 25% of fatal)
7. Goods vehicles (all N Categories) turning left and colliding with vulnerable road users (5% of all casualties, 10% of serious, 19% of fatal) From the analysis it was clear that accidents in which driver vision was a potential contributory factor occurred in all directions of vehicle movement. This suggests that the visibility of obstacles or other road users could be impaired in any direction. In addition, many of the scenarios involved LGVs and frequently VRUs were over represented in the ‘collision partner’ field.
ACCIDENT SCENARIOS To complement the cluster analysis of the STATS 19 accident data, specific OTS cases were identified that could be used as examples of the scenario types. In total the research identified seven scenarios from the OTS database including a forward moving Category M1 vehicle colliding with a scooter on roundabout (Marshall at el, 2012), Category M1 and M2 vehicles reversing into VRUs (Marshall et al, 2013) and LGV side-swipe accidents with other road vehicles (Summerskill et al, 2012). This paper reports on three of the scenarios that include collisions with VRUs and specifically cyclists.
Scenario 1: Category M1 - Crossroads This scenario examined the visibility from category M1 vehicles in a situation where the vehicle is proceeding straight on at a give-way controlled crossroads, crossing the main carriageway. In the OTS case, the driver of the M1 category vehicle has pulled out of the junction and collided with a cyclist already on the main carriageway.
Figure 1. Scenario 1 – Car pulls out at crossroads and collides with cyclist.
Figure available in the original PDF paper.
Scenario 2: Category M1 - T-Junction This scenario examined the visibility from category M1 vehicles in a situation where the vehicle is turning left at a T-junction from a shop car park into a major road. In the OTS case, the driver of the M 1 category vehicle has pulled out of the junction and a cyclist has collided with the side of the vehicle.
Figure 2. Scenario 2 – Car pulls out of T-junction junction and collides with cyclist.
Figure available in the original PDF paper.
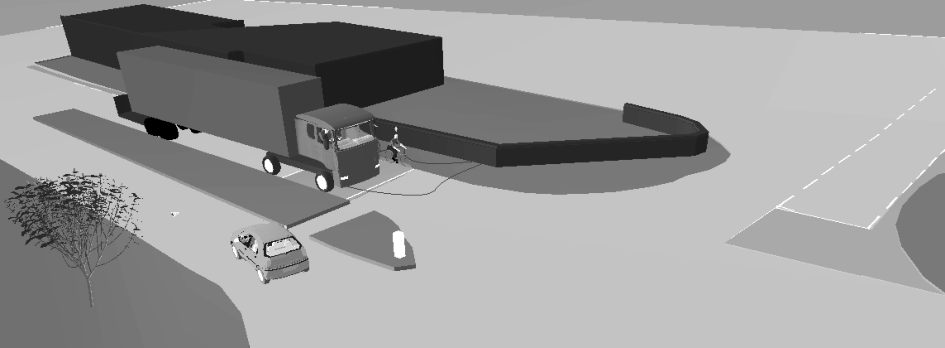
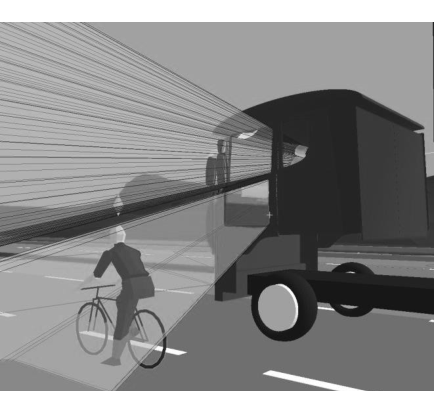
Scenario 3: Category N3 - Left Turn at Junction The scenario examined the visibility from category N3 vehicles in a situation where the vehicle is turning left from the main carriageway into a side-street. In the OTS case, the driver of the N 3 vehicle has pulled away from the traffic lights at the junction and turned left colliding with a cyclist proceeding straight on along the near-side (passenger side) of the vehicle.
Figure 3. Scenario 3 – LGV turns left at junction and collides with cyclist.
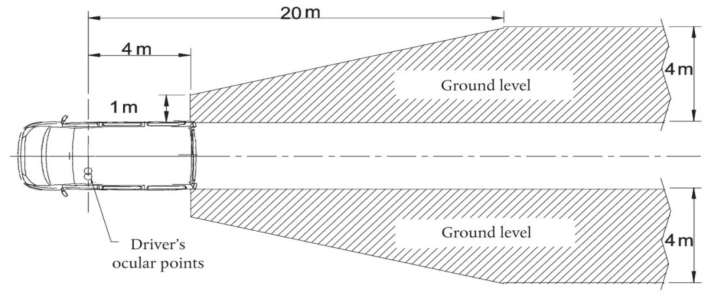
FIELD OF VIEW EVALUTION TECHNIQUES The expected field of view requirements as governed in the regulations such as 2003/97/EC (2004) and UN Regulation 46 (2009) typically describe a 2D area on the ground plane (Figure 4). To evaluate compliance with these areas a range of techniques have been employed in the literature, though many studies rely on real world methods to collect the visual areas, even if they are subsequently then translated into a digital medium. These real world methods rely on light projection techniques or use the driver’s vision and ability to see a target marker to Applied Digital Human Modeling & Simulation (2020) identify the field of view (e.g. Reed et al., 2000; Delmonte et al., 2012). In selected cases purely digital projection techniques have been employed to produce virtual evaluations of field of view (Tait and Southall, 1998; Way and Reed, 2003). In both types of approach the projections are typically resolved into a simplification of the field of view as a 2D area.
Figure 4. Minimum field of view specified in 2003/97/EC (2004) for Class III (exterior small) mirrors In reality, the field of view of a driver is a complex 3D volume, projecting from the eyes through window apertures and mirror surfaces. The intersection of this 3D projection with the ground plane is therefore only an approximation of driver vision. The projection of field of view from the eyepoint inherently creates a conical volume (Figure 5) and thus any projected ground plane area is merely a ‘slice’ through a volume that is not uniform in the vertical axis. The tapering of the volume towards the vehicle aperture or mirror can lead to a situation where a target may be within the visible ‘area’ but barely within the visible ‘volume’ and thus potentially not as visible as may be suggested by the type of diagram shown in Figure 4.
To provide a greater understanding of the visible volume afforded the driver a 3D volumetric field of view projection method was developed (Marshall et al., 2013). The projection method was prototyped, validated with real world tests and implemented within the SAMMIE DHM system (Porter et al. 2004). The method allows up to 10 projections of apertures to be combined with 10 projections of mirrors to provide an understanding of the full 360 degree field of view of the driver for any vehicle and conversely allow the identification of any blind spots.
Figure 5 shows the 3D volumetric projection method illustrating the field of view from the Class V close proximity ‘look-down’ mirror as fitted to a DAF XF Category N3 LGV. A human is stood within the visible area projected at the ground plane but the visible volume indicates that only their feet and part of their lower leg would be visible to the driver.
Figure 5. 3D volumetric field of view projection through a Category N3 LGV Class V mirror and the ability to view a target within the visible 2D area projected on the ground plane.
Figure available in the original PDF paper.
SCENARIO FIELD OF VIEW ANALYSIS For all of the scenarios the experimental setup included:
The identification of a range of vehicles (3 x M1: Volkswagen Golf, Volkswagen Touran and Hyundai i10, and 3 x N3: DAF XF, Volvo 480 and Scania R420) selected from new vehicle registration data to provide vehicles that are highly represented on UK roads and display a variety of configurations
The 3D contour scanning of the vehicles by FARO arm and subsequent modelling within PTC Creo
The import into the SAMMIE DHM system and the setup of mirrors and adjustment to the regulations
The determination of the limits of potential eye point through the modelling of the largest and smallest human models capable of operating the vehicle (e.g. 99th %ile Dutch Male and 5th %ile UK female)
The modelling of the road junction and positioning of the vehicles based upon the data available from the OTS database Scenario 1: Category M1 - Crossroads
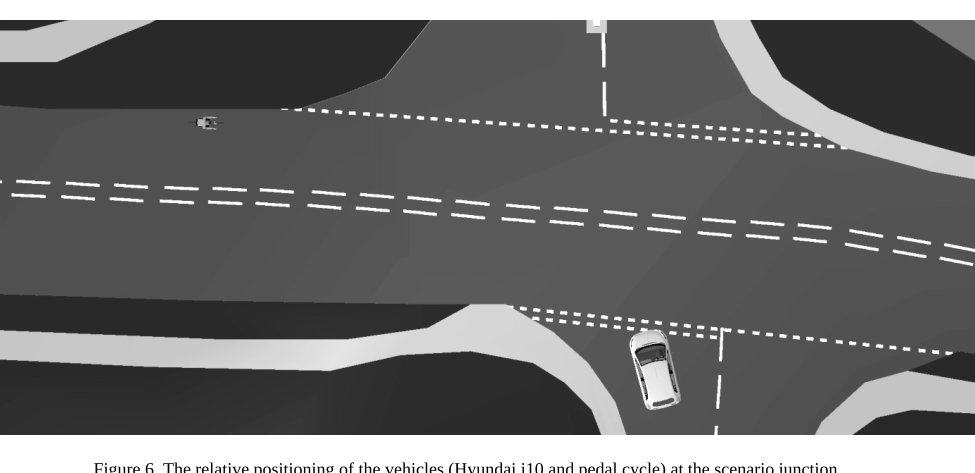
The scenario was modelled using the map data provided in the OTS case report (Figure 6). The angle of the junction to the main road has the potential to cause difficulty for the category M1 driver in terms of positioning for optimum visibility to the left of the vehicle to observe vehicles already on the main road travelling from left to right. The cyclist (circled) is positioned travelling along the main road from left to right across the path of the M 1 vehicle. The M1 vehicle is positioned to travel across the crossroads bearing slightly left as the junction is offset.
Figure 6. The relative positioning of the vehicles (Hyundai i10 and pedal cycle) at the scenario junction.
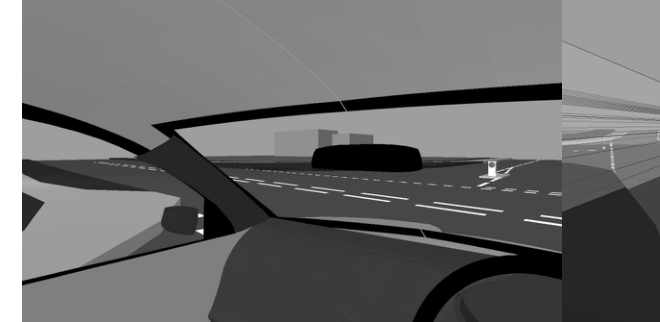
Figure 7 shows that in this position the cyclist is completely obscured by the nearside (left) A-pillar of the M 1 vehicle. The driver is looking to the right and left to check the coast is clear prior to pulling off.
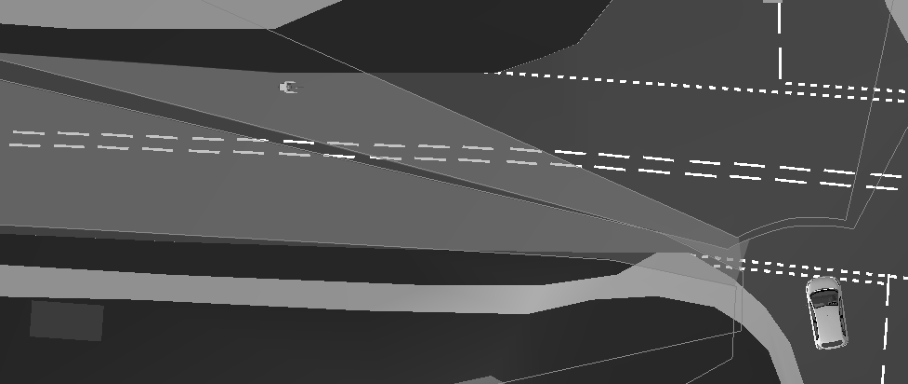
Figure 7. The view of the driver (99th %ile Dutch male) of the Hyundai i10 in the direction of the cyclist (direct vision on the left, volume projection on the right).Figure 8. The difference between the blind spot for the 5th%ile UK female (dotted line area) and the 99%ile Dutch male (solid line area).
For all of the assessed M1 vehicles and drivers there is an effective ‘corridor’ blind spot caused by the A-pillar. This blind spot’s location changes significantly between the two driver size extremes. For the larger drivers of each vehicle the blind spot allows the cyclist to get nearer to the junction and still be obscured. For the smaller driver the blind spot is much further to the left and so the cyclist is visible much sooner. Whilst the M 1 vehicle could pull out in front of the cyclist in either case there is a good chance that the cyclist would see the M 1 vehicle pulling out in front of them and be able to slow and take avoiding action if necessary. The closest the cyclist can get and still be obscured, is approximately 15m from the junction. Travelling at 20mph the cycle would take 1.677s to cover that distance and the cyclist would be able to clearly see the M1 vehicle pulling out from the junction. The conclusion from this evaluation is that the blind spot from the A-pillar was unlikely to be the only factor contributing to this accident and that the blind spot is relatively easy to overcome by the driver leaning or tilting their head to ‘look around’ the pillar.
Scenario 2: Category M1 - T-Junction As with scenario 1, map data provided in the OTS case report was used to model the scenario (Figure 9). The angle of the junction from the road filtering into the main road has the potential to cause difficulty for the category M 1 driver in terms of positioning for optimum visibility to the right of the vehicle to observe vehicles already on the main road travelling from right to left. The cyclist is positioned travelling along the main road from right to left across the path of the M1 vehicle. The M1 vehicle is positioned to make the turn to the left as smooth as possible by aligning the front of the vehicle relatively to the left as opposed to perpendicular to the main road.
Figure 9. The relative positioning of the vehicles (Volkswagen Touran and pedal cycle) at the scenario junction.
Figure available in the original PDF paper.
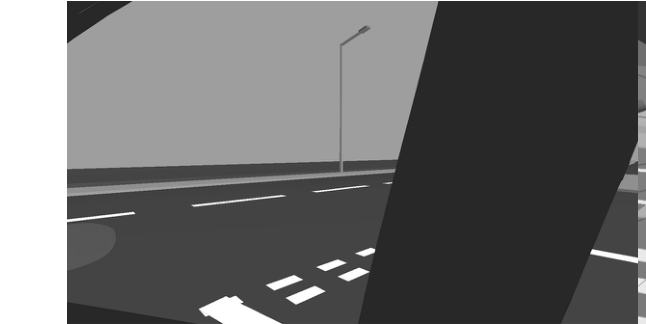
Figure 10 shows that in this position the cyclist is completely obscured by the B-pillar of the M 1 vehicle. The driver is looking to the right to check the coast is clear prior to pulling off.
Figure 10. The view of the driver (99th %ile Dutch male) of the Volkswagen Touran in the direction of the cyclist (direct vision on the left, volume projection on the right).Figure 11. For all vehicles evaluated there is a clear blind spot (dotted line area).
Figure available in the original PDF paper.
For all of the assessed M1 vehicles there is a similar blind spot effect from the B-pillar to that observed from the A- pillar in Scenario 1. This blind spot is only in a location likely to obscure the cyclist for the larger drivers of each vehicle as the eye point is further forward for the smaller driver and the field of view is clear through the front right window. It is possible that whilst the M1 driver is performing their observations prior to setting off that the cyclist could have travelled the length of this corridor to within 4.5m of the vehicle. If after glancing right and not seeing any oncoming traffic the driver would then focus their attention to the direction of turn to the left and set off causing the collision.
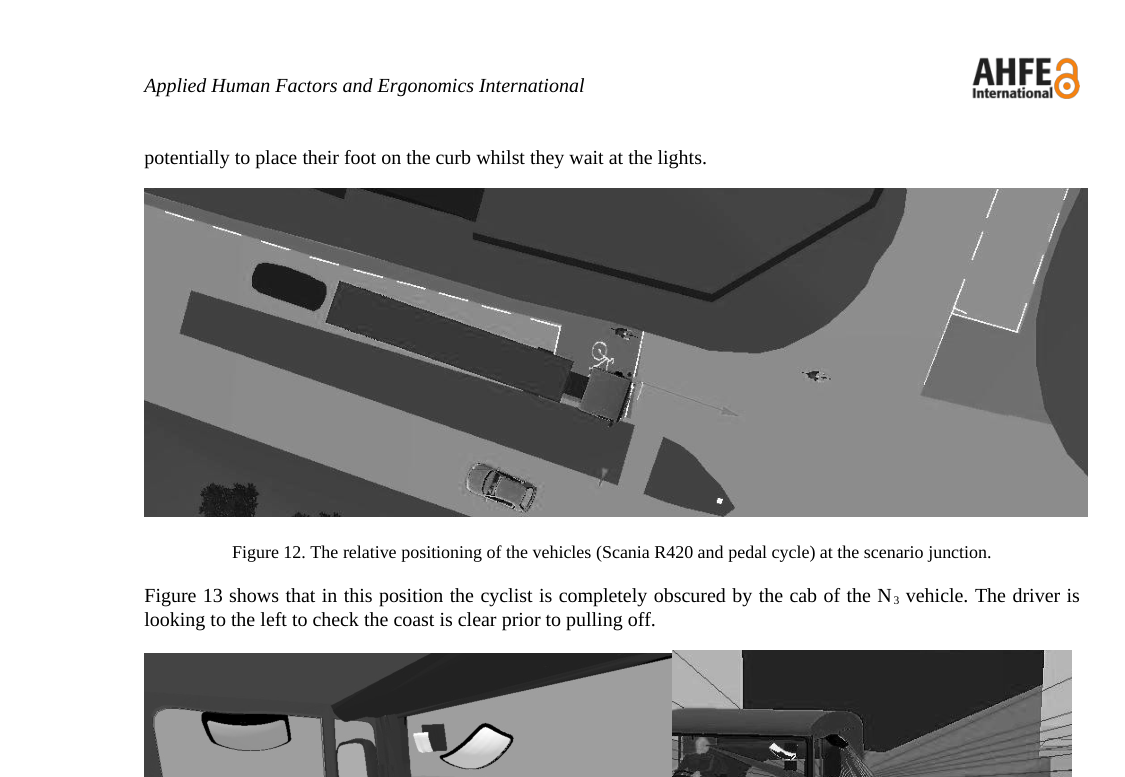
Scenario 3: Category N3 - Left Turn at Junction As before, map data provided in the OTS case report was used to model the scenario (Figure 12). A Category N3 vehicle is positioned to the right of their lane to provide the largest possible radius for the left turn. The cyclist (circled) is positioned to the left of the lane, against the curb to be as far away from the LGV as possible and potentially to place their foot on the curb whilst they wait at the lights.
Figure 12. The relative positioning of the vehicles (Scania R420 and pedal cycle) at the scenario junction.
Figure available in the original PDF paper.
Figure 13 shows that in this position the cyclist is completely obscured by the cab of the N 3 vehicle. The driver is looking to the left to check the coast is clear prior to pulling off.
Figure 13. The view of the driver (99th %ile Dutch male) of the Scania R420 in the direction of the cyclist (direct vision on the left, volume projection on the right).
For all of the right-hand drive N3 vehicles assessed there is a similar blind spot to the near-side (passenger side) of the vehicle. The cyclist would be not be visible to the LGV driver either through the passenger window, or in either the Class IV, V or VI mirrors in this position. The difference in eye point of the two drivers has negligible effect on the field of view. If the driver is unaware of the cyclist and the cyclist is unaware of the intention of the LGV to turn left, it is clearly possible for the collision to occur shortly after both vehicles set off.
DISCUSSION
The evaluations performed in this research identified that blind spots can occur in any direction around all of the vehicle Categories evaluated (M1, M2, N2, N3). In addition these blind spots appear to be a contributory factor in the recreation of accident scenarios taken from UK accident data. These blind spots vary in size and significance and are often influenced by the eye point of the driver, and thus by the size of the driver. For A and B-pillar obscuration an eye point closer to the pillar, combined with a larger pillar can lead to a significant blind spot, capable of obscuring other road users, particularly smaller visual targets such as VRUs. However, A and B-pillar obscuration can easily Applied Digital Human Modeling & Simulation (2020) be countered by the driver moving their eye point by titling their head or leaning the body. However, other contributory factors such as tiredness, the driver being in a hurry, busy road conditions with lots of visual demand, other distractions such as passengers, etc. could all lead to the driver failing to check the blind spot.
For LGVs the near-side blind spot is much more significant, is not affected by driver eye point and regardless of driver behaviour cannot be mitigated. Mirror adjustment is a key factor in minimising the blind spot, but even with mirrors adjusted to the Regulations, the blind spot still exists.
One outcome from the research was a recommendation to the UNECE to amend Regulation 46 to mandate a greater area extending laterally from the near-side of the vehicle. This amendment specified that the area of the ground plane that should be visible to the driver of Category N3 vehicles should be increased laterally from 2m, to 4.5m. The proposed amendment was presented to the United Nations GRSG committee at the 100th meeting in April of 2011.
In the evaluations performed to: identify blind spots; understanding the nature of blind spots; evaluate the effect of eye point; and in exploring solutions, digital human modelling and the volumetric projection technique offered a range of benefits. The ability to explore the scenarios in 3D with a range of driver size and vehicle was significantly more straightforward utilising a digital approach. It is acknowledged that the lead time in capturing vehicle data and setting up the models is high, but subsequent downstream activities are facilitated. The 3D volumetric projection technique provided a greater understanding of compliance with the 2D mandated areas and provided insight into the true field of view afforded to the driver. Not insignificantly the approach has also been fundamental in the communication of the findings. The ability to show the projections, and to provide fly-throughs of the scenarios has been positively received by drivers, operators, designers, and other professionals involved in road safety.
A further benefit of the digital approach is the ability to rapidly explore potential solutions or proposals for change. Since the completion of the project the Loughborough team have worked with Cemex a major UK operator of LGVs. Cemex have been proactive in road safety and have often implemented beneficial safety systems, and warnings on their vehicles in advance of legislation. An analysis was made of the impact of the fitment of a large coverage aftermarket mirror (SPAFAX VM5) that had the potential to meet the new Regulated area to the Cemex fleet of MAN TGA 26.340 tipper lorries. Due to the lower cab configuration of the MAN vehicles over those evaluated on the project, and the relatively wide coverage of the standard MAN Class V mirror, the potential benefits of the larger SPAFAX VM5 were not clear. After modelling the fitment of the aftermarket mirror to the MAN vehicles (Figure 14) the potential benefits were quickly illustrated and convinced the company to fit the SPAFAX VM5 to their entire fleet.
Figure 14. Projection of the standard fit Class V (left) vs. the aftermarket SPAFAX VM5 and the view from the passenger side window as found on the MAN TGA 26.340 tipper
Figure available in the original PDF paper.
In addition to mirror solutions the projection technique has also been used on preliminary investigations of window panels on the lower portion of the passenger door (Figure 15). The ability to rapidly alter the vehicle configuration in CAD and evaluate the field of view projections clearly highlight the potential benefits of a DHM approach.
Figure 15. Mock-up of a window aperture in the lower portion of the passenger side door of an LGV. Drivers view on the left, projection to the right.
CONCLUSIONS
This research reports on the evaluation of driver’s field of view and the use of a new 3D volumetric projection technique to investigate its impact on cyclist safety. The UK Department for Transport commissioned an evaluation into the potential of driver vision, and vehicle blind spots to be a causal factor in road traffic accidents. Using UK accident data, scenarios were identified for evaluation. The scenarios were modelled in addition to a range of vehicles and drivers including Category M1, M2, N2 and N3 vehicles. Evaluations were performed using a 3D volumetric projection method implemented within the existing DHM system SAMMIE. The evaluations highlighted blind spots in all vehicles resulting from the structure of the vehicle and their potential role in accidents. The most significant finding was a major blind spot to the passenger side of larger Category N3 LGVs. The blind spot appears between the coverage of the Class V ‘look-down’ mirror and the view from the passenger door window. The projection technique was instrumental in both locating the blind spot and in the exploration of solutions. The research resulted in a change to EU Regulation 46 to mandate a change to mirrors to remove the blind spot on future vehicles.
REFERENCES
2003/97/EC. (2004), “Directive 2003/97/EC of the European Parliament and of the Council on the approximation of the laws of the Member States relating to the type-approval of devices for indirect vision and of vehicles equipped with these devices”, Official Journal of the European Union. Delmonte, E., Manning, J. Helman, S. Basacik, D. Scoons, J. Chappell, J. Stannard, J. Jones, M,. Knight, I. (2012), “Construction Logistics and Cyclist Safety Technical Report”, Report PPR639, TRL. http://www.tfl.gov.uk/microsites/freight/documents/publications/construction-logistics-and-cyclist-safety-technical- report.pdf Hill, J.R., Cuerden, R.W. (2005), “Development and Implementation of the UK On the Spot Data Collection Study – Phase 1”,
Department for Transport Road Safety Research Report No. 59. http://www.dft.gov.uk/pgr/roadsafety/research/rsrr/theme5/ Lenard, J. Danton, R. Avery, M. Weekes, A. Zuby, D., Kühn, M. (2011), “Typical pedestrian accident scenarios for the testing of autonomous emergency braking systems”, ESV paper no. 11-0196. Marshall, R. Summerskill, S., Cook, S. (2013), “Development of a volumetric projection technique for the digital evaluation of
field of view”, Ergonomics, 0, pp.1-14, DOI: 10.1080/00140139.2013.815805. Marshall, R. Summerskill, S., Cook, S. (2012), “The Use of DHM Based Volumetric View Assessments in the Evaluation of Car A-Pillar Obscuration”, in Duffy, VG (ed) Proceedings of the 4th International Conference on Applied Human Factors and Ergonomics, AHFE, Advances in Applied Human Modeling and Simulation. Proceedings of the 4th AHFE Conference, San Francisco, California, USA, pp.255-264. Reed, M.P. Lehto, M.M., Flannaghan M.J. (2000). “Field of view in passenger car mirrors.” The University of Michigan, Applied Digital Human Modeling & Simulation (2020)
Transportation Research Institute, Report No. UMTRI-2000-23. RoSPA, (2012). “Cycling Accidents - Facts and Figures,” The Royal Society for the Prevention of Accidents, http://www.rospa.com/roadsafety/adviceandinformation/cycling/facts-figures.aspx Summerskill, S. Marshall, R., Cook, S. (2012), “The use of volumetric projection in Digital Human Modelling software for the
identification of Category N3 vehicle blind spots”, in Duffy, VG (ed) Proceedings of the 4th International Conference on Applied Human Factors and Ergonomics, AHFE, Advances in Applied Human Modeling and Simulation. Proceedings of the 4th AHFE Conference, San Francisco, California, USA, pp.245-254. Tait, A.R., Southall. D. (1998). “Drivers’ field of view from large vehicles – Phase 3 Report.”, Loughborough University.
Report for Department for Transport. UN Regulation 46. (2009), “Uniform Provisions for Devices for Indirect Vision and of Motor Vehicles with Regard to the Installation of these Devices”, UN ECE Vehicle Regulations. Way, M.L., Reed, M.P. (2003). “A Method for Measuring the Field of View in Vehicle Mirrors”, Proceedings of the SAE 2003
World Congress, SAE Paper No 2003-01-0297, Detroit, USA, March 2003, 1-8.
LISTED IN THE AHFE DIGITAL BOOKSTORE CATALOGUE
Explore the complete digital volume
Advances in Applied Digital Human Modeling
Read this individual research paper free through the original publisher, or explore the full digital proceedings book.
ISBN 978-1-4951-2094-7
Explore this ISBN in the AHFE Bookstore ↗Listed in the July 2026 bookstore catalogue; search by ISBN to confirm current availability · Digital book purchase optional