Seul Chan Lee, Ji Man Kim, Hwan Hwangbo, Yong Gu Ji (2021). Development of Visual Complexity Model Framework in Driving Context. In: Advances in Affective and Pleasurable Design. AHFE Open Access, vol. 14. https://doi.org/10.54941/ahfe100587
Recently, in-vehicle environments have become smart environment with advances in IT technology. The vehicle is no longer just a means of transportation but gets the nature of information system. Therefore, in order to convey more information than in the past, a variety of displays are set up in vehicle. The object of this study is to develop visual complexity model framework for evaluating system interface. To accomplish this, we reviewed the literature about complexity measures in terms of Human-Machine Interaction and analyzed the characteristics of in-vehicle environment characteristics. Then we suggest visual complexity model framework.
The development of information technologies changes the context of driving. In-Vehicle Information System (IVIS) provides a lot of functions. As the number of function of system is increasing, various displays are used for providing drivers with information. (e.g. Cluster, Head-Up Display, Center- facia Information Display, Rear mirror display, etc.). So driver is exposed to much information. Considering visual sensory is most critical modality (Sivak, 1996), risk of accident could be increased because visual information leads to driver distraction.
According to National Highway Traffic Safety Administration (NHTSA), 25% of traffic accident happened because of driver inattention (Wang et al., 1996). Stevens and Minton (2001) reported that one of the critical factors of traffic accidents is high-tech equipment, i.e. infotainment system, navigation system, telematics system, etc. Wickens(2002) presented that increasing in-vehicle technology is the cause of traffic accidents because visual attention resource of driver is limited.
As previous research analyzed, using large amount of information doesn’t only have effect on driver, also it is the cause of deterioration in driving performance (Chisholm et al., 2007; Horberry et al., 2006). Thus it is important to predict and measure accident risk. Previous studies of in-vehicle environment analyzed driver mental workload with driving task. In order to analyze the effect of non-driving task on driving performance, many variables were used, e.g. response time, missed events, lane-keeping ability, speed control (Castro, 2008). However, previous studies have mainly focused on driver workload rather than the complexity of system itself. So, it is impossible to verify whether complexity of system influence on driver perception or not. But, it is difficult to find cause and effect relationship between system and driver. Thus the object of this study is to suggest “Complexity” for analyzing effect of In-Vehicle Information Systems on driver and the framework for measuring it. Utilizing complexity, we will predict and control driver workload from parts of system being increased.
A study of complexity deals with various aspects. But, few studies analyzed Human-Machine Interaction (HMI) in the context of driving using the concept of complexity. Therefore our study includes three questions: What is visual complexity from HMI perspective? How visual complexity is explained based on theoretical basis? How do we measure the visual complexity? To answer these three questions, we analyze in-vehicle environment and driver behavior from the perspective of HMI. Then we suggest the framework for measuring visual complexity.
LITERATURE REVIEW
It is difficult to define complexity because the concept of complexity is complicated itself. Also, definitions of complexity are differentiated by purpose of analysis. Complexity stems from Latin word ‘complexus’ meaning entwined or twisted together. Generally speaking, complexity of certain system could be increased if more parts of system are districted or connected with each other.
Many researchers have been studied the complexity in various field of studies : information theory, general systems theory, cybernetics, non-equilibrium thermodynamics, catastrophe theory, deterministic chaos, complex adaptive systems (Heylighen, 1993). Xing and Manning(2005) also presented that complexity have been studied in many fileds, e.g. Physics, System, Mathematical science, Software engineering, Biology, Psychology.
Visual complexity also has been studied in various domain fields, such as image, web page, aesthetics etc. Olivia et al. (2004) studied perceptual dimensions of visual complexity of scenes. Michailidou et al. (2008, September) studied relationship between visual complexity and aesthetic perception. Guo et al. (2011) represented relationship between visual complexity perception and texture image. Forsythe (2009) evaluated different measures of complexity. Harper et al. (2009) analyzed relationship between use’s visual perception of web page complexity and user’s cognitive efforts. Lavie and Tractinsky (2004) assessed dimensions of perceived visual aesthetic of web sites.
Characteristics of visual complexity in terms of Human-Machine Interaction (HMI) In this study, we would define ‘Visual Complexity’ from a HMI perspective, especially, when driver perceive the visual information from in-vehicle display. In order to achieve this, we analyzed the characteristics of complexity in terms of system and driver.
Complexity of system in Human-Machine Interaction (HMI) In-vehicle systems collect data about internal/external environment, vehicle condition, etc. Systems provide drivers with information on the ground of the collected data. Drivers drive the car on the basis of this information and vehicle states are changing. These processes continue iteratively (figure 1). In these processes, drivers interact with systems through system interface. Drivers perceive the visual information through the display of system interface. Continually, drivers control the input device of system interface. So driver’s perceived visual complexity is the interface complexity in terms of system.
Figure 1. Process of Human-Machine Interaction in the context of driving.
The environment of in-vehicle system interaction is similar to the environment of in-aircraft system interaction. Cumming et al. (2010) suggested Human Supervisory Control complexity chain composed of Environmental complexity, Organizational complexity, Interface complexity, Cognitive complexity in Air Traffic Control Environment. According to this, interface complexity was defined “the complexity derived from controls and displays, which could include display font size, number of colors used in the display, or numbers and variety of buttons, levers, etc.” In conclusion, in-vehicle interface consist of visual information displays and maneuvering areas. Based on this study, we focus on information display as domain of perceived visual complexity.
Complexity of Human behavior in Human-Machine Interaction (HMI) Edmonds(1999) stated that complexity is meaningful relative to individual person. Moreover, information is perceived by each driver’s visual information process (Mihal & Barrett, 1976). Therefore, in order to define complexity, there should be discussion of these issues. Henneman and Rouse(1986) categorized complexity as Non- Behavioral complexity or Behavioral complexity in order to emphasize interaction between human and system in terms of cognitive engineering. Non-Behavioral complexity studies include complexity interested in certain system’s condition. Most studies on complexity belong to Non-Behavioral complexity, e.g. computational complexity, software complexity, physical system complexity, redundancy and complexity, subjective nature of complexity. Behavioral complexity studies include complexity interested in human’s psychological-behavioral characteristics. Relatively few researchers studied Behavioral complexity. Behavioral complexity studies are divided into Perceptual complexity and Problem-solving complexity. Perspective of this study is a perceptual complexity within behavioral complexity
According to Wickens(2002), steps of Human Information Processing include Sensory processing, perception, Response selection, Response excution in order. Human allocate their attention resource to each step and use working memory. In these processes, Sensory processing and perception steps are main focus of Perceptual complexity.
Characteristics of in-vehicle environment The definition of visual complexity of this study differs from that of web page or image studies. So it is important to consider characteristics of in-vehicle driving situation. There are two kinds of characteristics of visual display and visual search task.
First, several characteristics of in-vehicle visual display should be considered. As previously stated, there are increasing introduction of new information technology into in-vehicle environment. So there is an abundance of visual information provided to driver in vehicle environment. As a result, various visual displays are embedded in the vehicle. Different characteristics of each display have effect on visual task (Tan and Czerwinski, 2003). Also information is presented in different forms, e.g. text, icon, image, graph, etc. Diverse information formats influence Human Information processing. Especially, perception and cognition processes of visual information are different depending on information formats. . Lastly, visual displays are dynamic. Information is continuously changed with driving condition.. Xing(2004, 2005, 2007) studied the information complexity of Air Traffic Control automation displays. In-vehicle environments with advances in IT technology have become similar to in-air traffic control environment. Thus, it is also important to consider complexity in vehicle environments..
Second, characteristics of visual search task should be considered. In-vehicle situation, drivers were required to perform two or more tasks concurrently. Drivers perform additional visual task while they perform driving task at the same time. Many studies on IVIS, HUD analyzed the effect of using the system while driving task. Also there are many attributes that will affect driving such as driving experience, gender, age, others. And driving contexts also exit like a road conditions, weather, day, night, light, others. Lastly, Even minor error in driving context could become the cause of traffic accident. Therefore safety issues are first priority in driving context. The increasing complexity of in-vehicle systems leads to increase the possibility of driver’s error increased. So, Complexity can be used in order to predict and to decrease the possibility of traffic accident.
RESEARCH FRAMEWORK Visual complexity of this study includes two points of view. Visual complexity is display complexity in terms of system and is perceptual complexity in terms of driver. Besides, we will focus the complexity when drivers perform the visual task while driving context. On the basis of these perspectives, we analyze the visual complexity.
Visual complexity has been studied in a number of different fields. Among these studies, Cummings(2010) and Xing(2004, 2005, 2007) studied on complexity in similar environment of this study. Following these studies, we will suggest the factor of system, i.e. information structure attributes of in-vehicle display. Cummings(2010) revealed that general factors of complexity are size (of parts), variety (of parts), rules/interconnections (between parts). Also, Xing(2004, 2005, 2007) suggested that information complexity of Air Traffic Control(ATC) automation display composed of three factors : Quantity, Variety, Relation. Like this, Quantity, Variety and Relation are widely accepted factors of complexity. According to studies, we also used these three factors.
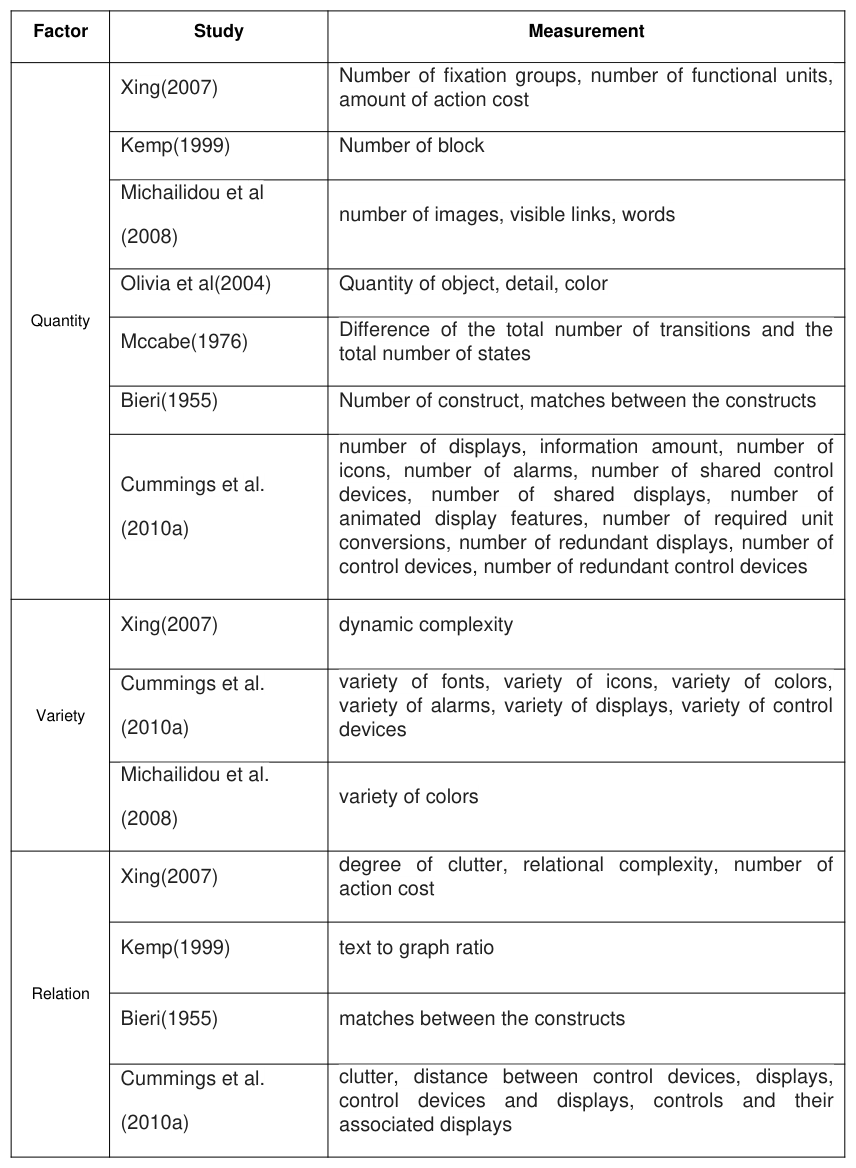
Quantity First factor of visual display is Quantity. The term “Quantity” means amount of something to measure or count. Generally, an increase in the quantity means that the amount of system parts is increased. Increasing the number of parts makes relationship more complicated. This leads to increase the possibility of interaction between parts. Many previous studies use Quantity as factor of complexity. Quantity measurements of related studies are summarized in the table below (Table 1). Especially, there are two complexity studies relative to Human-Machine Interaction. Xing (2007) chose “number of fixation groups, number of functional units, amount of action cost” as quantity measurement of information complexity. Cummings et al. (2010) defined “number of displays, icons, alarms, shared control devices, shared displays, animated display features, required unit conversions, redundant displays, control devices, redundant control devices” as quantity measurement of Human-System Interface.
Quantity factors of complexity are available for measuring visual complexity in vehicle environment. As the amount of information increases, the relationship between information and information become complicated. Especially in the driving situation, drivers perceive it as complex scene. Thus, in this study, we define “Quantity” factor as the number of units of visual display. The number of text, icon, gradation, indicator is quantity measurement of in- vehicle visual display. There are positive correlation between these quantity measurement and visual complexity.
Variety Second factor of visual complexity is Variety. The term “Variety” means that there are different aspects of parts. Generally, if system has variety, it consists of parts which are different from each other. An increase of variety in parts of system leads to increase their relationships. Variety attributes of system make to feel complex. Many previous studies use Variety as factor of complexity (Table 1). Xing (2007) defind “background color, component color, shape, size” as variety measurements of information complexity. Cummings et al. (2010) defined “variety of fonts, icons, colors, alarms, displays, control devices” as variety measurement of Human-System Interface.
Variety factors of complexity are available for measuring visual complexity in vehicle environment. Complexity of driver is different depending on type of information even though same amount of information. Thus, this study defines “Variety” factor as diversity characteristics of individual information of display. There is diversity of units of in-vehicle visual display, such as background color, component color, shape, size. There are positive correlation between these variety measurement and visual complexity.
Relation Last factor of complexity is “Relation”. Relation means that relationship between parts and parts of system. Quantity factor and Variety factor are characteristics of individual part. But Relation factor composed of structural aspects. Relation is a key factor in many studies (Table 1). Especially, Xing (2007) uses “degree of clutter, relational complexity, number of action cost” as relation measurements of information complexity. Cummings et al. (2010) defined “clutter, distance between control devices, displays, controls” as relation measurements of Human-System Interface. According to Tullis (1983), how user perceived information from the display is determined by four characteristics, i.e. overall density, local density, grouping, layout complexity.
Relation factors of complexity are available for measuring visual complexity in vehicle environment. It is different to perceive the level of complexity depending on “relation” even though same amount of information and level of variety. Thus, we define “Relation” factor as relational characteristics of units of in-vehicle visual display. Relation factors of in-vehicle visual display are clutter and number of division.
Table 1: Related study of three factors of complexity Factor Study Measurement
CONCLUSIONS
In conclusion, we suggest a framework for measuring visual complexity in order to evaluate in-vehicle interface. We reviewed previous study in order to analyze the complexity from the perspective of Human-Machine Interaction (HMI). First, we focus on in-vehicle visual display by analyzing in-vehicle systems. Second, we chose perceptual complexity by reviewing previous studies. For this, we define factors of complexity by analyzing previous complexity study and characteristics of in-vehicle environment. The framework composed of three factors : Quantity, Variety, Relation. This framework integrates human factors in the context of driving. We defined “Quantity” factor as the number of units of visual display, “Variety” factor as the diversity of units of in-vehicle visual display, “Relation” factor as relational characteristics of units of in-vehicle visual display.
Future study is needed to find measurement of each factor of visual complexity. Moreover, we will develop structural equation of visual complexity. This equation enables us to evaluate the n-vehicle system interface. Then we will be able to predict the driver’s workload arise from in-vehicle interface.
ACKNOWLEGEMENTS This work was supported by Mid-career Researcher Program through NRF grant funded by the MSIP (Ministry of Science, ICT and Future Planning) (Grant-# NRF-2013R1A2A2A03014150).
REFERENCES
Bieri, J. (1955). Cognitive complexity-simplicity and predictive behavior. The Journal of Abnormal and Social Psychology, 51(2), 263. Castro, C. (2008). Human factors of visual and cognitive performance in driving. CRC Press. Chisholm, S. L., Caird, J. K., Lockhart, J., Fern, L., & Teteris, E. (2007). Driving performance while engaged in
and opacity part ii: Methods and Tools to Assess HIS Complexity.Massachusettes Institute of Technology, Cambridge, MA. Edmonds, B. (1995). What is Complexity?-The philosophy of complexity per se with application to some examples in evolution.
The evolution of complexity. Forsythe, A. (2009). Visual Complexity: Is That All There Is?. In Engineering Psychology and Cognitive Ergonomics (pp. 158- 166). Springer Berlin Heidelberg. Guo, X., Asano, C. M., Asano, A., & Kurita, T. (2011, September). Visual Complexity Perception and Texture Image
Characteristics. In Biometrics and Kansei Engineering (ICBAKE), 2011 International Conference on (pp. 260-265). IEEE. Harper, S., Michailidou, E., & Stevens, R. (2009). Toward a definition of visual complexity as an implicit measure of cognitive load. ACM Transactions on Applied Perception (TAP), 6(2), 10. Henneman, R. L., & Rouse, W. B. (1986). On measuring the complexity of monitoring and controlling large-scale systems.
335-356. Lavie, T., & Tractinsky, N. (2004). Assessing dimensions of perceived visual aesthetics of web sites. International journal of human-computer studies, 60(3), 269-298. McCabe, T. J. (1976). A complexity measure. Software Engineering, IEEE Transactions on, (4), 308-320. Michailidou, E., Harper, S., & Bechhofer, S. (2008, September). Visual complexity and aesthetic perception of web pages. In
Proceedings of the 26th annual ACM international conference on Design of communication (pp. 215-224). ACM. Mihal, W. L., & Barrett, G. V. (1976). Individual differences in perceptual information processing and their relation to automobile accident involvement.Journal of Applied Psychology, 61(2), 229. Olivia, A., Mack, M. L., Srestha, M., & Peeper, A. (2004). Identifying the perceptual dimensions of visual complexity of scenes.
26th Annual Meeting of the Cognitive Science Society. Sivak, M. (1996). The information that drivers use: is it indeed 90% visual?.PERCEPTION-LONDON-, 25, 1081-1090.
Stevens, A., & Minton, R. (2001). In-vehicle distraction and fatal accidents in England and Wales. Accident Analysis & Prevention, 33(4), 539-545. Tan, D. S., & Czerwinski, M. (2003). Effects of visual separation and physical discontinuities when distributing information
across multiple displays. In Proc. Interact (Vol. 3, pp. 252-255). Tullis, T. S. (1983). The formatting of alphanumeric displays: A review and analysis. Human Factors: The Journal of the Human Factors and Ergonomics Society, 25(6), 657-682. Wang, J. S., Knipling, R. R., & Goodman, M. J. (1996, October). The role of driver inattention in crashes: New statistics from the
1995 Crashworthiness Data System. In 40th Annual Proceedings of the Association for the Advancement of Automotive Medicine (pp. 377-392). Wickens, C. D. (2002). Multiple resources and performance prediction.Theoretical issues in ergonomics science, 3(2), 159-177. Xing, J. (2004). Measures of information complexity and the implications for automation design (No. DOT/FAA/AM-04/17).
FEDERAL AVIATION ADMINISTRATION OKLAHOMA CITY OK CIVIL AEROMEDICAL INST. Xing, J., & Manning, C. A. (2005). Complexity and automation displays of air traffic control: Literature review and analysis (No.
DOT/FAA/AM-05/4). FEDERAL AVIATION ADMINISTRATION OKLAHOMA CITY OK CIVIL AEROMEDICAL INST. Xing, J. (2007). Information complexity in air traffic control displays (pp. 797-806). Springer Berlin Heidelberg.
LISTED IN THE AHFE DIGITAL BOOKSTORE CATALOGUE
Explore the complete digital volume
Advances in Affective and Pleasurable Design
Read this individual research paper free through the original publisher, or explore the full digital proceedings book.
ISBN 978-1-4951-2109-8
Explore this ISBN in the AHFE Bookstore ↗Listed in the July 2026 bookstore catalogue; search by ISBN to confirm current availability · Digital book purchase optional