Cristina Pires Dos Santos, Maria João Pereira Neto, Marco Neves (2021). Procedures and methods for a more effective practical research in Information Design. In: Human Systems Engineering and Design (IHSED2021): Future Trends and Applications. AHFE Open Access, vol. 21. https://doi.org/10.54941/ahfe1001118
1 Universidade de Lisboa, Lisbon School of Architecture, CIAUD – Research Center in Architecture, Urbanism and Design, Rua Sá Nogueira, Polo Universitário, Alto da Ajuda, 1349-055, Lisboa, Portugal and Polytechnic Institute of Beja, Rua Pedro Soares Apartado 6155, 7800-295 Beja, Portugal. ↗
2 Universidade de Lisboa, Lisbon School of Architecture, CIAUD – Research Center in Archi-tecture, Urbanism and Design, Rua Sá Nogueira, Polo Universitário, Alto da Ajuda, 1349-055, Lisboa, Portugal ↗
The present study portrays part of a methodology that was designed with a view to its applicability to a project in the field of Information Design (ID) for the interpretation and dissemination of the Heritage of a region. It was intended that the infographic project to be carried out a posteriori would reflect the Natural and Cultural Heritage of the region of Aljezur, Portugal, which would be presented visually (through infographics), in order to contribute to a multidimensional exploration of that same Heritage. This was to be achieved in a virtual context, aiming at the transmission and sharing of information in a more intelligible, visual and memorable way. Starting from the problematics: a) What functional, aesthetic, and technical aspects do we have to consider when representing different specifications of the heritage? and, b) What different aspects of Heritage require specific visual representations and differentiated solutions, for a more reliable representation of information, improving its understanding? the following hypothesis was formulated: different types of heritage require some different options and visual resources. Thus, using the case study method, an attempt was made to visually analyze a set of examples of infographics applied to Heritage, to try to find guidelines that support a solution for the realization of the aforementioned project. The objective was to make a survey and detect trends and patterns regarding the visual resources and styles used, organization and presentation of information. This took into account variables inherent to the various specificities of Heritage and information, associated with the region of Aljezur (and which are representative and may apply to other regions of the country). It was also intended, when doing this analysis, to identify which examples best fulfill the proposed objectives for the presentation of visual information, with a view to a practical component.The performed analysis was based on the entire literature review in the area of ID, categorizations associated with different infographics, functional, aesthetic, and cognitive principles inherent to the practice of ID, highlighted by the authors referenced throughout the research. At the same time, an in-depth visual search of several examples of infographics representing various types of Heritage was carried out (with the application of a non-participative observation and visual archive). This search formed the basis for organization and selection of multiple case studies, and the subsequent application of an analysis method built from the literature review. Of the 163 infographics compiled, 76 were selected for multiple case studies and application of the analysis method, resulting in a table/matrix.The adopted procedure proved to be essential for assessing methods and procedures, in the treatment of general and particular patrimonial information sets, and for direct application in the achievement of the proposed project. It was found that different types of Heritage require different options and visual resources, as well as differentiated solutions, which are more suitable for different types of heritage information and for a more reliable representation of the information, thus improving its understanding. It also contributed to an increased awareness of the options available for the infographics of the proposed project, and led to a reflection on certain theoretical aspects evaluated in the literature review, taking into account real practical examples.
We are constantly looking for information because we want to be informed so that we can make better decisions. We are, however, increasingly demanding about how we access information. In the specific case of Natural and Cultural Heritage, where how information is presented is essential for a physical or online visit to be carried out more qualitatively, this requirement becomes fundamental for an audience that longs for obtaining information about a specific heritage place and that sometimes finds it disorganized or dispersed. Thus, it was intended to answer these problems through a research project, INFOSPOT.PT website (Santos, 2019), an Infographic Directory for Portuguese Natural and Cultural Heritage1. The project pretends to compile and allow access to information in an organized, direct, and integrated way, permitting connection between all the characteristic parts of the heritage of a territory through infographics, contributing to a more accessible and structured knowledge. Consequently, we tried to achieve what methods and procedures we could adopt, so that, from a selected region (Aljezur, Portugal), we could accomplish and communicate visual information about its heritage (natural and cultural). This article will focus on part of the methodology designed for this research project, more specifically, to support the practical component of the project that aims to implement INFOSPOT.PT website. The methodological issue described in the present article consisted of analysis to support the study of multiple cases (to provide a comparative analysis of infographics representing natural and cultural heritage information). Starting from the problematics: a) What functional, aesthetic, and technical aspects do we have to consider when representing different heritage specifications? and, b) What different aspects of heritage require specific visual representations and differentiated solutions, for a more reliable representation of information, improving its understanding? the following hypothesis was formulated: different types of heritage require some different options and visual resources.
Thus, during the theoretical-practical research already mentioned, an in-depth visual research was carried out (with the application of a non-participatory observation and 1 It will be important to note that only a few links are active as the project is still in progress.
Human Systems Engineering and Design (IHSED 2021) https://openaccess.cms-conferences.org/#/publications/book/978-1-7923-8987-0 visual archive), which constituted the basis for organization and selection for, the multiple case study. This considered variables inherent to various specificities of heritage and information, associated with the region of Aljezur (and which are representative and may be applied to other regions of Portugal, but also other countries). It was also intended, when doing this analysis, to identify which examples best fulfill the proposed objectives for the presentation of visual information, with a view to a practical component. Next, the methods and procedures adopted will be described aiming at practical research that was carried out later.
PROCEDURES AND METHODS ADOPTED TO SUPPORT A PROJECT IN INFORMATION DESIGN (ID) Visual research (observation method and visual archive)
In the initial stage, several examples of infographics related to heritage were collected throughout the research, covering any of its expressions (cultural and natural). Subse- quently, it was necessary to organize, to group by specificity and to archive with some identifying data, the examples that were being collected. Gray and Malins (2004) define the method of observation as a classic method of research in the fields of Social Sciences and Art and Design. The authors state that it has the function to watch something, someone, an environment or a situation closely with the goal of accurately record the activities or situation in order to capture data relevant to the research project issues. In the context in question, we consider non-participatory observation, where the researcher intends to remain objective (neutral) and separated from the object/person/situation being observed. In a preliminary phase, the observation was casual and exploratory, where the intention was to gather infographics related to the heritage and that in a very initial observation could be considered reference examples. There was no specific criterion for the selection of infographics, other than the fact that in an initial viewing, they appear to be visually balanced, with complex visual elements and having a considerable density of information, which could be indicative of being reference examples for the practical component (however, these considerations were initially very preliminary and superficial). Martin and Hanington (2012) argue that the researcher must observe with an open mind even if he/she has a guiding set of questions. As they were found, the infographics were organized, collecting some data common like title, date of publication, authorship, editor or client, country, and link of origin, for the subsequent study of multiple cases. Gray and Malins (2004) list several methods used in research in Art and Design, in which case the method characterized by digital databases, visual and textual glossaries and archives stands out. As a visual archiving method for the collected infographics, the INFO_archives website was created (Santos, 2018). In this way, the infographics were grouped into different pages on the website, according to the following
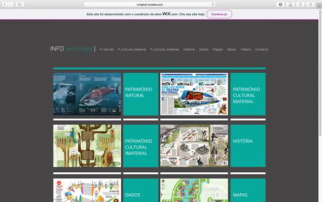
Human Systems Engineering and Design (IHSED 2021) https://openaccess.cms-conferences.org/#/publications/book/978-1-7923-8987-0 typologies: Natural Heritage (NH); Tangible Cultural Heritage (TCH); Intangible Cultural Heritage (ICH); History; Data; Maps and Various. In total there are 163 infographics on the INFO_archives website. The research covered not only infographics that portray the heritage, but examples that were considered useful, due to the solutions presented, in helping the practical component (the case of infographics organized by the themes, History, Data, Maps and Various). In Figure 1 we can see two print screens of the website.
Figure 1. Homepage of INFO_archives website (left) and “Natural Heritage” page of INFO_archives website (right). (Santos, 2018) Multiple Case Study of Infographics representing Natural and Cultural Heritage Information
Martin and Hanington (2012) state that case studies are inclusive, assuming that consideration of the whole is more advantageous than a reductionist study of parts. Yin (1994) says that the case study does not require control by the researcher over the behavior of the occurrence and also reinforces that it contemplates contextual conditions that are relevant to the objective of the study. In this context, the present method was applied to several static infographics. Evaluation items were established, which we considered essential for a comparative analysis that was intended to be extensive and detailed, to try to gather the information that was representative of certain trends or design choices, applied to the representation of visual information. Each analyzed infographic was submitted to a qualitative evaluation grid, built from the theoretical research carried out previously so that the final results tried to cover a totality and approach to the reality of the practice of infographics for the heritage. It was intended to be able to compare visual solutions resulting from each specificity of heritage information and to reflect on some theoretical aspects achieved in the literature review. For the comparison to be carried out more effectively, a table/matrix was created that allowed to analyze and transmit a large amount of information in a compressed space (Gray and Malins, 2004). The present application of the method was structured from Yin (1994), being adapted to the needs and specificities of this study. In order to ascertain these causes and start the study, a case study protocol was elaborated, which served as a reference and which guided the preparation of the study (where purposes, number of infographics analyzed, factors, procedures, and questions were recorded to deepen the analysis to be undertaken). It is important to emphasize
Human Systems Engineering and Design (IHSED 2021) https://openaccess.cms-conferences.org/#/publications/book/978-1-7923-8987-0 that a triple case study was carried out, as three groups of multiple cases were created (each group of infographics representative of each heritage specificity). Finally, a report was prepared for each study group to be able to better analyze the results obtained.
Explanation of the method The performed analysis was based on the entire literature review in the area of ID, categorizations associated with different infographics, functional, aesthetic, and cognitive principles inherent to the practice of ID, highlighted by the authors measured through-out the research. Of the 163 infographics archived on the INFO_archives website, 76 were selected for analysis (33 relating to information on NH; 25 on TCH, and 18 on ICH). The analysis table/matrix was created exclusively for application of the method in question, however, some of the analysis items were adapted from the study by Segel and Heer (2010) and from the identification of elements which were considered important for comparison after reviewing the literature. The analyzed infographics are all static (printed or online), according to the designations presented by the authors Coates and Ellison (2014), Krum (2014), Lankow, Ritchie and Crooks (2012) and are listed in the case study datasheets (Figure 2) that were created for analysis (the infographics can be viewed in a larger dimension on the INFO_archives website already mentioned). For each infographic was assigned an identification (in the case of infographics for Natural Heritage, the identification assigned was "PN1", "PN2", and so on; Tangible Cultural Heritage with "PCM1", "PCM2", etc., and for Intangible Cultural Heritage with "PCI1", "PCI2", etc.)2. For a more rigorous analysis, the infographics were printed in A3 for- mat, and the analysis was also complemented by viewing the most meticulous details, on the computer screen and through the website mentioned above. Three analysis ta- bles/matrices were performed for each heritage specificity (Figure 2). It will also be important to mention that for the qualitative assessment items, the following scale was considered: 1 (+) low, 2 (++) medium, 3 (+++) High.
2 The applied designations are abbreviations of the words in Portuguese.
Human Systems Engineering and Design (IHSED 2021) https://openaccess.cms-conferences.org/#/publications/book/978-1-7923-8987-0
Figure 2. Image of the datasheet with the case study, relating to the Tangible Cultural Heritage (left) and image of the respective case study analysis table/matrix (right) Thus, we considered the following items for analysis (which are distributed over the columns of the analysis table/matrix as we can see in Figure 2, right image): Genre (Segel and Heer, 2010): in static infographics, we considered two different formats, the format for printing (that is proportional to a standard page for printing) and the format for online presence (tall infographic), according to Krum (2014). Then we subdivide the items according to the predominant context of the researched infographics (if they exist in a context of social communication - newspapers or magazines, communication for Municipalities, in a business or organization, or editorial context as is the case of the books). Objective: to classify the analyzed infographics and their context. Visual Narrative (Segel and Heer, 2010):
Figure available in the original PDF paper.
Figurative representations (Coates and Ellison, 2014), (Krum, 2014), (Lankow et al. 2012): to assess whether the analyzed in-fographics use three-dimensional representations made in 3D CGI software, digital or analog two-dimensional illustrations or photographs;
Visualization systems (Coates and Ellison, 2014), (Lankow et al. 2012), (Abdullah and Hübner, 2006), (Frascara, 2015), (Meirelles, 2013), (Tufte, 2001): to check if the infographics analyzed contain pictograms or symbols, maps, diagrams, graphs, and tables;
Visual Structuring (Segel and Heer, 2010): - Central, top, and bottom framing: to identify the placement of the main visual element in the layout; in the case of the central framing, the main visual element is considered to be centralized or simultaneously occupies all parts of the layout; this analysis item was identified after viewing numerous infographics (Santos, 2018);
- Consistency and Visual Harmony (Pettersson, 2012): quantitatively assess, on a scale from 1 (+) to 3 (+++), whether there are consistency and visual harmony between all the figurative and non-figurative elements - texts);
- Visual Hierarchy (Coates and Ellison, 2014), (Pettersson, 2012), (Heskett, 2002), (Cairo, 2013), (Roberts and Thrift, 2005), (Jute, 1995): quantitatively assess, on a scale from 1 (+) to 3 (+++), whether there is visual hierarchy between all the figurative and non-figurative elements - texts;
- Legibility and Clarity (Coates and Ellison, 2014), (Pettersson, 2012), (Heskett, 2002), (Cairo, 2013), (Roberts and Thrift, 2005), (Jute, 1995), (Lidwell, Holden and Butler, 2003): quantitatively assess, on a scale from 1 (+) to 3 (+++), if there is legibility in reading information and if it is presented in a clear way to the reader;
- Predominant color (Coates and Ellison, 2014), (Frascara, 2015), (Gibson, 2009), (Knight and Glaser, 2011), (Tufte, 1990): to check if there is a predominant color according to the specificities of the presented heritage information - the predominant color was registered when it existed, when there was no relevant predominant col-or, the field was marked in gray;
Emphasis (Coates and Ellison, 2014), (Frascara, 2015), (Lankow et al. 2012),
Human Systems Engineering and Design (IHSED 2021) https://openaccess.cms-conferences.org/#/publications/book/978-1-7923-8987-0
- Detailed views (to identify the use of visual zoom strategies, to isolate or highlight certain information);
- Distinction of information (to identify the use of the visual strategies used, to highlight certain information - the identification of the distinction strategy was explained in a footnote in the tables/matrices);
- Visual dynamics (to measure quantitatively, on a scale from 1 (+) to 3 (+++), if there is visual dynamics between the elements that make up the layout; Objective: to visually analyze how infographics are designed - what visual elements are used and how they are arranged in the layout; whether aspects such as hierarchy, consistency and harmony, legibility and clarity were taken into account, whether strategies of visual prominence were used for a better understanding of the information; whether there are predominant colors in the approach to the various specificities of heritage. Narrative Structure (Segel and Heer, 2010):
Ordering (Segel and Heer, 2010), (Coates and Ellison, 2014), (Krum, 2014): to assess the order in which the information is read by the reader - if the reading is linear, through random access, or user-directed path; Linear reading was considered when it follows the normal reading orientation, that is, from left to right and from top to bottom; random reading is considered when the reader tends to be able to read the information in a non-linear way, without prejudice the perception (these cases are very common when we are reading a map or information that is closely linked to the illustration - the order in which we read the information turns out not to be very relevant). Regarding the user-directed path item, it is considered that there is an intention of the information designer to indicate or suggest a certain reading orientation, through specific graphic forms, such as the example of using arrows or the intentional disposition of the groups of information in the layout;
Information (Knight and Glaser, 2011), (Tufte, 1990): in this case, we considered the scope of the information, if it was macro, that was, representative of a more generalized theme (such as information about a group of species in a protected natural park or a set of monuments), or micro, representative of a more specific theme (such as, for example, information about a specific species or a single monument);
Types of organization: for this item, we adopted the acronym LATCH, by Wurman (2001) which represents for the author, the five ways of organizing information - Location, Alphabet, Time, Category, and Hierarchy; what was intended was to check if the infographics analyzed used any of these forms of organization;
Auxiliary graphics elements (Coates and Ellison, 2014), (Meirelles, 2013), (Pettersson, 2012), (Tufte, 1990), (Hansen, 2000), (Ware, 2012), (Arnheim, 1974), (Mijksenaar, 1997): it was intended to verify whether elements such as subtitles with colors or patterns, subtitles with numbers or letters, subtitles with pictograms, leader lines, or arrows were used for a better understanding of the information; Objective: structurally analyze how infographics were conceived - if there was any predominant reading order in the analyzed infographics; to relate the type of
Human Systems Engineering and Design (IHSED 2021) https://openaccess.cms-conferences.org/#/publications/book/978-1-7923-8987-0 information (macro and micro) with its organization in the layout; whether organizational strategies or auxiliary graphic elements were used for a better understanding of the information communicated.
Degree of complexity (Cairo, 2013): the opposite characteristics that Cairo uses in his Visualization Wheel have been adapted to assess the degree of complexity of an infographics. Like Cairo, the characteristics that determine if a graph is more complex and deeper (degree of abstraction, functionality, density, multidimensionality, originality and novelty - marked in blue color on table/matrix) in opposition to the characteristics that the author considers to be representative of a type of a graph more intelligible and shallower (degree of figuration or iconicity, decoration, lightness, unidimensionality, familiarity and redundancy - marked in yellow color on table/matrix). Each characteristic was evaluated on a scale from 1 (+) to 3 (+++). Cairo (2013) draws attention to the fact that this evaluation is somewhat subjective, but at the same time, he considers it to be an essential tool for evaluating his infographics. We consider that it can be a useful tool to reflect on the characteristics or degree of complexity most suitable to represent specificities intrinsic to heritage information. At this point, it is very important to evaluate the degree of abstraction/figuration that an infographic will have to have to be able to communicate a certain message, as well as to evaluate the balance between form and function, transposed to the duality functionality/decoration, or the various layers of infor- mation presented (multidimensionality/unidimensionality). Objective: to analyze the degrees of complexity of infographics and relate them to the type of information presented. We consider that this point is somewhat subjective, but it contributed to a more in-depth reflection and interpretation of some characteristics of the analyzed infographics, helping to make conceptual options in the active research.
CONCLUSIVE RESULTS AFTER ANALYSIS As we have seen, the veracity of the hypothesis is confirmed, as different types of heritage require some different options and visual resources, also answering the research questions formulated initially. This analysis also intended to justify several functional, aesthetic, and technical aspects, which we must consider in the representation of different specifications of heritage. It contributed to an awareness of the options to be taken for infographics to be carried out in the practical project, reflecting on some theoretical aspects learned in the literature review, considering real practical examples. Synthesizing, there were differences between the three groups (NH, TCH, ICH), according to the heritage typology, mainly in the main figurative representations (the three-dimensional representations, are predominant in the TCH and two-dimensional illustrations in the other two cases - NH and ICH). It is assumed that this differentiation occurs due to an approximation to scientific illustration and the need for more controlled details, in the case of NH and ICH; in the case of TCH, the three-dimensional representation is more effective due to its
Human Systems Engineering and Design (IHSED 2021) https://openaccess.cms-conferences.org/#/publications/book/978-1-7923-8987-0 flexibility and optimization in the presentation of perspectives, through different angles, including exploded views, being a more adapted representation. It was also found that there are more similarities between the infographics related to the NH and ICH, with the infographics representing the TCH being more differentiated. In any case, the majority is expressed here, not invalidating that a 2D illustration may also be representative of cultural equipment or 3D of an animal species. Another differentiating aspect between the specificities of the heritage was the color and the strategies to emphasize (for example, in NH, the chromatic variety used reflects a lot of the colors of nature, like green, ocher, or blue in the presentation of marine species). Regarding the visualization systems in the analyzed infographics, it was noticed the less frequent use of pictograms and symbols in ICH, although we consider that this differentiation is not very relevant. Maps, diagrams, and graphs are frequently used in any of the typologies, with tables being less used.
As for the similarities to be highlighted, we emphasize that the central framing is the most used, regardless of the types of heritage and that aspects such as consistency and visual harmony, visual hierarchy, legibility, and clarity, have practically the maximum evaluation attributed to the analyzed examples, perhaps because the initial selection criterion was to choose examples that, at first glance, seemed to have quality and be reference examples to follow in the practical component. Another common aspect to highlight is that most of the analyzed examples had as their final context, the publication in the social communication and in print format, not being a differentiating factor in the representation of the diverse specificities of the heritage. As for the reading order that is suggested to the reader, the linear or random reading record show very balanced results in the three forms of heritage, so there is nothing to highlight. As for the type of organization most used, organization by location and category are unanimous. As for the auxiliary graphic elements used in the infographics, it was found that the leader lines were present in most cases.
Regarding the degree of complexity, we can say that concerning the analyzed in- fographics, any type of heritage represented is significant in terms of more complex and deeper. As for the most consensual aspects, we highlight density, multidimensionality, and novelty in information. As for the remaining aspects, we highlight the fact that they are more figurative and familiar in the case of TCH. Of the analyzed infographics, those representing the ICH are more decorative than the other types. It was found that different types of heritage require different options and visual resources, as well as differentiated solutions, which are more suitable for different types of heritage information and for a more reliable representation of the information, thus improving its understanding. It also contributed to an increased awareness of the options available for the infographics of the proposed project and led to a reflection on certain theoretical aspects evaluated in the literature review, taking into account real practical examples.
Human Systems Engineering and Design (IHSED 2021) https://openaccess.cms-conferences.org/#/publications/book/978-1-7923-8987-0
REFERENCES
Abdullah, R., Hübner, R. (2006). Pictograms, Icons & Signs - A Guide to Information Graphics. London: Thames and Hudson. Arnheim, R. (1974). Art and Visual Perception: A Psychology of the Creative Eye.
Berkeley: University of California Press. Cairo, A. (2013). The Functional Art – An Introduction to Information Graphics and Visualization. San Francisco: New Riders – Voices that Matter. Coates, K., Ellison, A. (2014). An Introduction to Information Design. London:
Laurence King Publishing. Frascara, J. (2015) “What is Information Design?”, in: Information design as principled action. Making information accessible, relevant, understandable and usable, Frascara, Jorge (Ed.). pp. 5-55. Illinois: Common Ground Publishing. Gibson, D. (2009). The Wayfinding Handbook- Information Design for Public
Places. New York, USA: Princeton Architectural Press. Gray, C., Malins, J. (2004). Visualizing Research: A Guide to the Research Process in Art and Design. Surrey: Ashgate. Hansen, Y.M. (2000) “Visualization for Thinking, Planning, and Problem Solving”,
in: Information Design, Jacobson, Robert (Ed.). pp. 193-220. Massachusetts: The MIT Press. Heskett, J. (2002). Toothpicks and Logos: Design in Everyday. UK: Oxford University Press. Jute, A. (1995). Grelhas e Estrutura do Design Gráfico [Grids and Structure of
Graphic Design]. Lisbon: Destarte. Knight, C., Glaser, J. (2011). Diagramas – Grandes Ejemplos de Infografía Contemporánea [Diagrams - Great Examples of Contemporary Infographics]. Barcelona: Editorial Gustavo Gili. Krum, R. (2014). Cool Infographics: Effective Communication with Data
Visualization and Design. Hoboken: Wiley. Lankow, J., Ritchie, J., Crooks, R. (2012). Infographics. The Power of Visual Storytelling. Hoboken: Wiley. Lidwell, W., Holden, K., Butler, J. (2003). Universal Principles of Design.
Massachusetts, USA: Rockport. Martin, B., Hanington, B. (2012). Universal Methods of Design. Beverly, USA: Rockport Publisher. Meirelles, I. (2013). Design for Information: An Introduction to the Histories,
Theories, and Best Practices Behind Effective Information Visualizations. Gloucester: Rockport Publisher. Mijksenaar, P. (1997). Visual Function: An Introduction to Information Design. New York: Princeton Architectural Press. Pettersson, R. (2012). It Depends: ID – Principles and Guidelines. 4th edn. Austria:
Institute for Information Design (IIID). Website: http://www.iiid.net/PublicLibrary/Pettersson-Rune-ID-It-Depends.pdf>. Accessed April 2021. Roberts, L., Thrift, J. (2005). The Designer and the Grid. Hove, UK: RotoVision. Santos, Cristina. (2019). INFOSPOT.PT Website: https://www.infospot-pt.com Santos, Cristina. (2018). INFO_archives Website: https://crispire1.wixsite.com/infoarchives
Human Systems Engineering and Design (IHSED 2021) https://openaccess.cms-conferences.org/#/publications/book/978-1-7923-8987-0
Segel, E., Heer, J. (2010) “Narrative Visualization: Telling Stories with Data”, in: IEEE Trans. Visualization & Comp. Graphics (Proc. InfoVis). Website: http://vis.stanford.edu/files/2010-Narrative-InfoVis.pdf>. Accessed Mar 2021 Tufte, E.R. (2001). The Visual Display of Quantitative Information. 2nd edn.
Cheshire: Graphics Press. Tufte, E.R. (1990). Envisioning Information. Cheshire: Graphics Press. Ware, C. (2012). Information Visualization: Perception for Design. 3rd edn. Boston: Morgan Kaufmann. Wurman, R. S. (2001). Information Anxiety 2. Indianapolis, Indiana: Que. Yin, R. K. (1994). Case Study Research – Design and Methods. 2nd edn. USA: Sage
Publications, Inc.
Human Systems Engineering and Design (IHSED 2021) https://openaccess.cms-conferences.org/#/publications/book/978-1-7923-8987-0
LISTED IN THE AHFE DIGITAL BOOKSTORE CATALOGUE
Explore the complete digital volume
Human Systems Engineering and Design (IHSED2021): Future Trends and Applications
Read this individual research paper free through the original publisher, or explore the full digital proceedings book.
ISBN 978-1-7923-8987-0
Explore this ISBN in the AHFE Bookstore ↗Listed in the July 2026 bookstore catalogue; search by ISBN to confirm current availability · Digital book purchase optional