Karen Caballero-Rojas, Oscar Palacios-Aguilar, Ernesto Altamirano-Flores (2021). Total Productive Maintenance Model applying SMED and FMEA to increase the overall efficiency of equipment (OEE) in the food sector. In: Human Systems Engineering and Design (IHSED2021): Future Trends and Applications. AHFE Open Access, vol. 21. https://doi.org/10.54941/ahfe1001187
In the manufacturing sector, the Lean philosophy is well known for proposing the reduction of waste within the industry, which is manifested in terms of downtime within companies. In a sector of large proportions such as mass consumption food, the reduction of these losses translates into significant savings in the business economy, so key indicators, such as the OEE, are used to evaluate the efficiency of the process in terms of quality, performance and availability. Within this context, this article presents an application model of Total Productive Maintenance (TPM), using FMEA for the diagnosis and SMED for the optimization of the results, within its structure; which was validated through a pilot test, achieving an increase of 5.17% in the OEE of the sauce production line of the company in the case study, demonstrating the effectiveness of the model within contexts whose losses lie in prolonged machine downtime.
Human Systems Engineering and Design (IHSED 2021) https://openaccess.cms-conferences.org/#/publications/book/978-1-7923-8987-0
INTRODUCTION
Within the national economy, the second largest industrial sector is made up of manufacturing companies, which achieved a growth of 12.2% in 2018 (Ríos, 2019) and they contribute 13% to the national GDP (INEI, 2018). One of the most important subsectors within the manufacturing sector is the food industrial sec-tor, being considered one of the most significant subsectors within the national economy, which contributed 2.6% to the national GDP. Therefore, based on the relevance of the sector for its national and international market share, and for its social contribution; waste within industrial processes, resulting in low levels of productivity and reduced levels of productive capacity, translate into economic losses of great magnitude.
From the perspective of the Lean philosophy, the aforementioned conse-quences are caused due to operational causes called waste. Within this denomi-nation we can find problems such as overproduction, long waiting times, product quality defects, among others. Likewise, taking a maintenance management ap-proach, these wastes are mainly caused by equipment failures whose occurrence generally occurs unexpectedly, which is why corrective, preventive and predic-tive maintenance is used. In order to monitor the efficiency of a machine or pro-duction line, it is essential to review the quality, performance and availability rates. To achieve this objective in a flexible and complete way, the global equip-ment efficiency (OEE) is used, which is a key indicator that evaluates the produc-tive status of the machine or production line based on the three indicators men-tioned above. For this reason, when a production process has an OEE of less than 50%, a very low overall performance is interpreted, the cause of which lies in the quality, availability or performance of machinery, individually or simultaneous-ly, referring to a measure below the world standard of 84%. Due to what was pre-viously explained, this research proposes to elaborate an improvement proposal that raises the OEE of the production process through a model of implementation of Total Productive Maintenance (TPM), which includes the use of the FMEA and SMED tools within its structure of app. To achieve this objective, a review of the corresponding literature was carried out according to the sector, the problem and the proposed techniques. Likewise, the model was validated through a pilot test in a sauce production company belonging to the mass consumption food sector. The case study includes the analysis of the main problem, the identification of its causes, the elaboration of the corresponding diagnosis, the application of the model and the comparison of the results.
STATE OF THE ART This section presents the literature review carried out with the objective of providing theoretical foundations to the criteria used in the research for the elab-oration of the model. The selected articles were classified into four typologies in order to present a theoretical basis in an orderly manner. Next, the articles select-ed according to their
Human Systems Engineering and Design (IHSED 2021) https://openaccess.cms-conferences.org/#/publications/book/978-1-7923-8987-0 typology will be presented:
Food sector Within this typology we consider the articles that provide us with a more com-plete perspective of the problem within companies in the sector. As is the case of the KSCC company, belonging to the mass consumption of beverages sector, which presented an OEE of 35.27%. Its main problem was the low productivity of the process, due to poor maintenance management (Bataineh, Al-Hawari, Alshraideh and Dalalah, 2019). Similarly, an investigation was validated in a croissant production company, whose OEE equaled 75.0% due to machine speed losses and downtime in the process. In both investigations, the OEE calculation methodology and the implementation of an efficient and innovative TPM model were studied in depth, achieving considerable increases in the overall efficiency of equipment.
Reduced overall equipment efficiency The articles within this typology inform us about the relationship between the deficient production process and maintenance management, thus allowing us to focus more precisely on the solution to our problem. Within this context, the OEE value that fluctuates around 50% means that the machine is operating at half its capacity, a fact that translates into operational inefficiency and high operating costs (Nallusamy, 2016). In the same way, this idea is complemented by stating that equipment downtime and quality losses are important obstacles against pro-duction objectives, due to the cost of production lost due to downtime and the increase in maintenance cost (Saleem, Nisar, Khan, Khan and Sheikh, 2017). Likewise, the implementation of the technique is supported by the close relation-ship between OEE and line productivity, showing a strong positive linear rela-tionship between the OEE index and production performance (Sharma, 2019). On the other hand, the OEE, whose value is the product of the quality, performance and availability rates; it is directly affected by the six major losses, which are: equipment failure, set-up losses, micro- stop losses, reduced speed, reduced per-formance and quality defects (Acharya, Garg, Singh and Gahlaut. 2018).
Solution techniques Within this selection, the Lean Manufacturing methodology and some of its tech- niques were considered, such as: SMED and TPM, techniques that play a very important role in reducing waste in the industry. As is the case of SMED, which is a technique used to reduce machine or setup change time, which consists of con-verting internal activities into external activities, through an analysis of each activity and its times (Antosz and Pacana, 2018). As far as diagnostic tools are concerned, the FMEA matrix was evaluated, a tool that evaluates three funda-mental aspects regarding unforeseen failures: severity, occurrence and detection (Baynal, Sari and Akpinar,
Human Systems Engineering and Design (IHSED 2021) https://openaccess.cms-conferences.org/#/publications/book/978-1-7923-8987-0
2018). This functionality provides us with great sup-port when analyzing failure modes within management. On the other hand, total productive maintenance (TPM) is a methodology whose objective is to achieve zero breakdowns, zero defects and zero downtime. The TPM has eight pillars for its full implementation. Within these pillars is autonomous maintenance, which consists of preparing operators for participation in identifying breakdowns and remedial measures. Autonomous maintenance is therefore essential for TPM im-plementation, as it enables higher production throughput (Guariente, Antoniolli, Ferreira, Pereira and Silva, 2017).
Implementation methodologies Within this typology are the articles that provide us with a more complete per-spective of how the improvement proposal should be outlined. As is the case of the study of a metal mechanic, which provides a detailed TPM implementation scheme, focused on mobile maintenance. The implementation of the TPM man-aged to increase the availability, quality, performance and OEE of the company, increasing the production in 15.63%, reducing the decomposition time in 23.14%, the rejection rate in 17.94% and increasing the OEE in 17.08% (Singh, Singh and Sharma, 2018). Likewise, the case of an automotive company, which presents a TPM planning and programming proposal focused on the PQCDSM key perfor-mance indicators. After the implementation of the TPM, an improvement in productivity was obtained, resulting in an increase of 232,200 units per month and a reduction of 12 million in operating cost (Sharma, Singh and Rastogi, 2018). On the other hand, in a case study carried out by means of a pilot test in a machining company, a specific scheme for the implementation of the TPM was carried out, aimed at improving equipment based on the MTTR and MTBF indica-tors (Morales Méndez and Rodriguez, 2017). This study achieved a 108% im-provement over MTBF and 30.2% over MTTR, factors that contributed to a 12% improvement over OEE. Regarding the SMED implementation methodology, an application model integrated to visual management was analyzed (Rosa, Silva, Ferreira and Campilho, 2017). This model used tool identification maps and re-lied on the 5S in order to maximize its results, obtaining as a result a reduction in the detection time of the line equivalent to 210 minutes, representing 58.3% compared to the initial time. In conclusion, the classification using this typology helped us to identify the most efficient and innovative implementation models, whose panorama will serve as a guideline for the preparation of this work.
INPUT View fundamentals
The proposed model is fundamentally based on the TPM implementation struc-ture established in thirteen integrated steps (Bataineh, Al-Hawari, Alshraideh and Dalalah, 2019), considering the use of the FMEA tool, where the notable impact that this technique produces within the manufacturing sector is exposed, contem-plating a
Human Systems Engineering and Design (IHSED 2021) https://openaccess.cms-conferences.org/#/publications/book/978-1-7923-8987-0 situation similar to that of exposed problem. In the same way, conclu-sive evidence was found that affirms that the SMED tool can achieve more re-markable results if it is used in conjunction with other tools (Lozano, Saenz-Díez, Martínez, Jiménez and Blanco, 2019), which is why it is mainly recommended as a support tool.
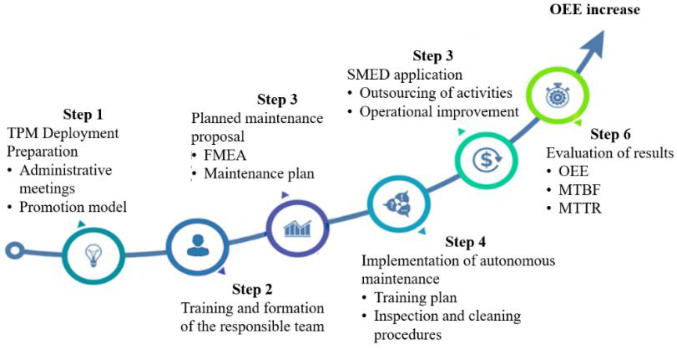
General view The proposed model for the implementation of the TPM focused on planned maintenance (MP) and autonomous maintenance (MA), has as its main objective to increase the OEE of the line. For this reason, the PM was focused on reducing excess times within the CIP washing process, caused by breakdowns within the system during washing. Likewise, we consider as the scope of this pillar, losses due to frequent equipment failure in packaging equipment and delays in the exe-cution of maintenance activities due to lack of spare parts. To achieve these ob-jectives, the FMEA tool was used as a diagnostic tool to facilitate the identifica-tion of critical equipment within the process. On the other hand, the MA aims to mitigate the losses due to prolonged scheduled maintenance due to the lack of technical maintenance personnel, in addition to speeding up the maintenance applied to packaging and CIP washing. Finally, to increase the impact of the mod-el on the OEE, the SMED tool was used, which will help us to propose an opti-mized structure in the washing procedure.
The general structure of the model presented in Fig. 1 a series of specific steps for each component. These detailed steps contribute to directing the implementa-tion of the model towards the previously mentioned objective, so they will be explained and developed according to the mentioned problem.
View indicators Finally, to monitor the progress of the implementation and carry out a quantita-tive analysis of the impact that our model will have, it was proposed to use the following indicators classified by each component.
Global Equipment Efficiency (OEE). The OEE will be the main indicator that will determine the success of our model; As explained above, the main objective is to develop a TPM and SMED implementation model that allows to increase OEE by reducing machine downtime. The formula for calculating the OEE is as follows: 𝑂𝐸𝐸 = 𝐴𝑣𝑎𝑖𝑙𝑎𝑏𝑖𝑙𝑖𝑡𝑦 × 𝑃𝑒𝑟𝑓𝑜𝑟𝑚𝑎𝑛𝑐𝑒 × 𝑄𝑢𝑎𝑙𝑖𝑡𝑦 (1)
Human Systems Engineering and Design (IHSED 2021) https://openaccess.cms-conferences.org/#/publications/book/978-1-7923-8987-0
Figure 1. General contribution model As can be seen in the indicator calculation formula, the OEE is an indicator that integrates the availability, throughput rate and quality rate of the machine or production line in question, allowing the industry a complete perspective of the productive situation of your processes. Mid Time to Repair (MTTR). Because our model focuses on stoppages due to unforeseen breakdowns, it was decided to use the mean repair time to measure the impact of our model on minimizing breakdowns.
𝑀𝑇𝑇𝑅= (𝑇𝑜𝑡𝑎𝑙 𝑚𝑎𝑖𝑛𝑡𝑒𝑛𝑎𝑛𝑐𝑒 𝑡𝑖𝑚𝑒)
(𝑁𝑢𝑚𝑏𝑒𝑟 𝑜𝑓 𝑓𝑎𝑖𝑙𝑢𝑟𝑒𝑠) (2) Mid Time Between Failure (MTBF). Similarly, reducing the number of breakdowns will directly influence the frequency with which they occur. For this reason, we will use the mean time between failures, in order to reduce the monthly failure frequency.
MTBF = (𝑇 𝑎𝑣𝑎𝑖𝑙𝑎𝑏𝑙𝑒−𝑇 𝑚𝑎𝑖𝑛𝑡𝑒𝑛𝑎𝑛𝑐𝑒)
(𝑁𝑢𝑚𝑏𝑒𝑟 𝑜𝑓 𝑏𝑟𝑒𝑎𝑘𝑑𝑜𝑤𝑛𝑠) (3) Time Variation. As mentioned in previous lines, the functionality of the SMED tool lies in reducing the time of the process to which it is applied. It is for this reason that to validate the results of this tool we will use the percentage time variation as an indicator that will allow us to know the proportion of time that was reduced.
∆ 𝑇𝑖𝑚𝑒 = (𝑆𝑡𝑎𝑟𝑡 𝑡𝑖𝑚𝑒−𝐸𝑛𝑑 𝑡𝑖𝑚𝑒)
(𝑆𝑡𝑎𝑟𝑡 𝑡𝑖𝑚𝑒) (4)
Human Systems Engineering and Design (IHSED 2021) https://openaccess.cms-conferences.org/#/publications/book/978-1-7923-8987-0
VALIDATION Validation scenario
This case study will be carried out within the production process of sauces, whose production process is classified into two main sub-processes: manufactur-ing and packaging, which make up the entire production line. The sauce plant works three shifts a day, that is, 24 hours a day and every six production shifts a washing process is carried out that lasts two shifts. The validation method that will be used will be carried out through a pilot test that will include one of the three packaging machines called Volpak 7 and the line's CIP system, due to the large number of stops they represent.
Initial diagnosis The process in question initially had an OEE equivalent to 45.37%, which is ap- proximately 10.89 hours of production, that is, the company produces less than half of its total capacity, the rest of the non-productive hours being equivalent to $ 31,466.89 daily. The availability represented the lowest rate of the OEE com-ponents with a value of 51.46%, for which an additional analysis was carried out to deepen on the machine stops within the production process of sauces. The stop that represents the largest proportion is the CIP wash stop, which represents a stop time of approximately 16 hours. However, the plant management recorded washing times that exceeded the planned one, occupying a maximum of 26 stop-page hours. This long time is due to frequent failures that occur within the CIP system during washing, delaying the process. In addition, unforeseen equipment failures also occur during the production process, resulting in extensive long-term shutdowns. The following shows the MTTR, and MTBF in CIP and Volpak 7 hours, in addition to the OEE calculated from May to July.
Table 1: Indicators in the period May-Jul 2020 Indicator 2020|
Table available in the original PDF paper.
May June July MTTR (volpak 7) 2.63 4.41 3.75 MTBF (volpak 7) 69.37 85.59 61.70
MTTR (system CIP) 10.26 11.18 10.64 MTBF (system CIP) 14.22 18.29 16 OEE (volpak 7) 45.37% 43.96% 41.67% On the other hand, within scheduled and unscheduled maintenance activities, excess times occur, a fact that is called prolonged maintenance. The main causes of these
Human Systems Engineering and Design (IHSED 2021) https://openaccess.cms-conferences.org/#/publications/book/978-1-7923-8987-0 delays are produced by the lack of technical maintenance personnel, due to the fact that the number of technicians assigned to the sauce plant is small and therefore they are often not available. Likewise, these long times are also gener-ated by the lack of critical spare parts within the spare parts warehouse, so the purchase order is issued when a failure occurs.
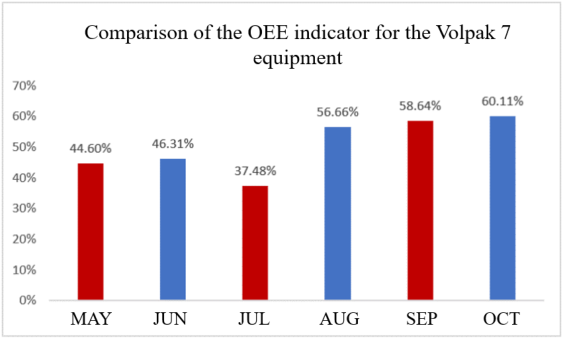
Design of the validation As explained in the previous chapter, our model consists of six steps, the first step, the preparation of the TPM, began with the first meeting with the plant man-agement. This meeting discussed the diagnosis of the current situation of the company and the need to implement the TPM within the line. Likewise, the vali-dation of the model was proposed through a pilot test, taking as a restriction the unique application to the equipment called Volpak 7 of the packaging process and to the CIP system. Subsequently, the training plan according to our proposal began, starting with the training of the personnel in charge of operating the CIP system and then the personnel in charge of packaging, regarding autonomous maintenance activities. Due to the income restrictions by the company, the plant management made sure to take the daily timing of the CIP system and the Volpak 7 in order to make a more accurate calculation of the OEE, MTTR and MTBF. The maintenance plan, the proposed instructions and the procedure resulting from the application of SMED began to be executed as of August, obtaining the following results in the OEE:
Figure 2. OEE for the volpak 7 equipment As can be seen, as of August there was a notable increase in the OEE of the Volpak 7, reaching 60% in the month of October. This 3.45% improvement in the machine's OEE translates into a 5.17% increase in the line's OEE, managing to exceed 50%.
Human Systems Engineering and Design (IHSED 2021) https://openaccess.cms-conferences.org/#/publications/book/978-1-7923-8987-0
CONCLUSIONS
The results of the pilot test demonstrate the utility of the proposed model conclu- sively, achieving increasing production capacity by 10.49% and reducing the cost per machine stop by $ 86,990.80. In this way, an increase of 5.17% in the OEE of the line was obtained, a value that is close to the average increase of 6% made in past investigations, despite the limitations established for the pilot test. However, it is important to note that the company where the validation was de-veloped has an efficient operating structure and a large market share in its sector, so financing, data collection and the adoption of improvements within the pro-cesses they were carried out in an agile way. On the other hand, it is important to note that the estimated budget for the full implementation of the model was $ 22,112.75, a value that due to the limitations of the pilot test was reduced to $ 2,432.70. From this economic variation, we can conclude that the largest propor-tion of the initial cost was due to the cost of operator training. It is for this reason that we recommend evaluating internal training options in order to reduce the overall budget of the model.
REFERENCES
Acharya, A., Garg, D., Singh, N., and Gahlaut, U. (2018). “Plant effectiveness improve-ment of overall equipment effectiveness using autonomous maintenance training: - A case study”. Int. J. Mech. Prod. Eng. Res. Dev., vol. 9, no. 1, pp. 103–112. Antosz, K. and Pacana, A. (2018). “Comparative analysis of the implementation of
the SMED method on selected production stands”. Teh. Vjesn., vol. 25, pp. 276–282. Bataineh, O., Al-Hawari, T., Alshraideh, H., and Dalalah, D. (2019), “A sequential TPM-based scheme for improving production effectiveness presented with a case study”. J. Qual. Maint. Eng., vol. 25, no. 1, pp. 144–161. Baynal, K., Sari, T., and Akpinar, B. (2018). “Risk management in automotive
manufac-turing process based on FMEA and grey relational analysis: A case study”. Adv. Prod. Eng. Manag., vol. 13, no. 1, pp. 69–80. Guariente, P., Antoniolli, I., Ferreira, L. P., Pereira, T., and Silva, F. J. G. (2017).
“Im-plementing autonomous maintenance in an automotive components manufacturer”. Pro-cedia Manuf., vol. 13, pp. 1128–1134. INEI. (2018). “Compendio Estadístico Perú 2018”. Lozano, J, Saenz-Díez, J. C., Martínez, E., Jiménez, E, and Blanco, J. (2019).
“Center-line-SMED integration for machine changeovers improvement in food industry”. Prod. Plan. Control, vol. 30, no. 9, pp. 764–778. Morales Méndez, J. D, and Rodriguez, R. S. (2017). “Total productive maintenance (TPM) as a tool for improving productivity: a case study of application in the bottleneck of an auto-parts machining line”. Int. J. Adv. Manuf. Technol., vol. 92, no. 1–4, pp. 1013–1026.
Human Systems Engineering and Design (IHSED 2021) https://openaccess.cms-conferences.org/#/publications/book/978-1-7923-8987-0
Nallusamy, S. (2016). “Enhancement of productivity and efficiency of CNC machines in a small scale industry using total productive maintenance”. Int. J. Eng. Res. Africa, vol. 25, pp. 119–126. Ríos, M. (2019, Jan 10). “Produce: Industria manufacturera creció 12.2% en no-
viembre del 2018”. Diario Gestión, NOTICIAS GESTIÓN. Rosa, C., Silva, F. J. G., Ferreira, L. P., and Campilho, R. (2017). “SMED methodology: The reduction of setup times for Steel Wire-Rope assembly lines in the automotive in-dustry”. Procedia Manuf., vol. 13, pp. 1034–1042. Saleem, F., Nisar, S., Khan, M. A., Khan, S. Z., and Sheikh, M. A. (2017). “Over-
all equipment effectiveness of tyre curing press: A case study”. J. Qual. Maint. Eng., vol. 23, no. 1, pp. 39–56. Sharma, R. (2019). “Overall equipment effectiveness measurement of TPM manager model machines in flexible manufacturing environment: A case study of automobile sector”. Int. J. Product. Qual. Manag., vol. 26, no. 2, pp. 206–22. Sharma, R., Singh, J., and Rastogi, V. (2018) “The impact of total productive
maintenance on key performance indicators (PQCDSM): A case study of automobile manufacturing sector”. Int. J. Product. Qual. Manag., vol. 24, no. 2, pp. 267–283. Singh, J., Singh, H.. and Sharma, V. (2018). “Success of TPM concept in a manufacturing unit – a case study”. Int. J. Product. Perform. Manag., vol. 67, no. 3, pp. 536–549.
Human Systems Engineering and Design (IHSED 2021) https://openaccess.cms-conferences.org/#/publications/book/978-1-7923-8987-0
LISTED IN THE AHFE DIGITAL BOOKSTORE CATALOGUE
Explore the complete digital volume
Human Systems Engineering and Design (IHSED2021): Future Trends and Applications
Read this individual research paper free through the original publisher, or explore the full digital proceedings book.
ISBN 978-1-7923-8987-0
Explore this ISBN in the AHFE Bookstore ↗Listed in the July 2026 bookstore catalogue; search by ISBN to confirm current availability · Digital book purchase optional