Wang Xiaoxiong, Wu Jinchun, Wang Haiyan (2022). The influence of color on web page complexity and color recommendation. In: Usability and User Experience. AHFE Open Access, vol. 39, pp. 303–309. https://doi.org/10.54941/ahfe1001721
The complexity of a web page has a great influence on the user's understanding and comprehension. There are many factors that can affect page complexity, such as color, block number, number of texts, etc. Color is not only a factor that affects complexity, but also a factor that attracts the user's attention most on the page. Previous studies on color mainly focused on the basic attributes, such as hue, purity and brightness. However, there were few studies that utilized quantitative calculation methods to evaluate color complexity and webpage color matching calculation. Thus, the present study is set out to explore the impact of colors on page complexity, considering three main factors: the number of colors, color area and color ranges. In order to determine the upper limit of the number of colors for page complexity, a polit study was carried out using webpages as an example, then experiment was conducted within this number of colors to explore the most comfortable color area and color distance matching. The result revealed that: If the number of color is less than six, it will not feel very complicated. The average color area value of the entire web page should vary between 200-1100 pixels (assuming the area of each pixel is 1), the recommended color range is between 0.5-1. Finally, we proposed a page complexity calculation formula including the above three elements which are used as independent variables to calculate the page complexity value. Color matching of webpage can be recommended within this range. The complexity of the matching page obtained in this way is relatively moderate, and it looks comfortable and concise for users. The formula of this article can evaluate the complexity of existing pages, certainly it can also be utilized to develop a set of color complexity calculation model.
The complexity of the web page is closely related to the user’s effectiveness in recognition, degree of preference, etc. Thus, the influence of color on the complexity of the page cannot be ignored. This article is about studying the effect of color on the complexity of the page as a function of the color attri- bute. There are several colors that make people comfortable. How to match the color area and color distance may make this page more comfortable and uncomplicated. Research has found that simple pages are more likely to be liked by users and easier to grasp the key points.
In the past, the research on color focused primarily on the fundamental attributes of color, hue, purity and brightness. But in this article, we have selected three aspects that have a significant impact on the page to be analy- zed, namely the number of colors. It directly affects people’s visual experience. According to Chien-Yin Laia, Pai-Hsun Chenb, Sheng-Wen Shiha, Yili Liuc, Jen-Shin Honga in the article, color monitors are the most widely used. The color models are the RGB (red, green, blue) model and the HSV (hue, satu- ration and value) model. RGB color space is far from uniform in perception, meaning that two colors with equal distances in the color space are not neces- sarily equal in perception. It is known that the HSV model is closely related to how humans describe and interpret colors, and provides better perceptual consistency than the RGB (Paschos, 2001). The HSV color difference space is a 3D space with approximately uniform visual spacing in terms of color difference judgment. In the HSV color space, two colors with a larger dista- nce are completely different in the human eyes. Therefore, in this study,
the calculation of the color distance between two blocks of pixels is based on the Euclidean difference between the two colors in the HSV color space (Chien-Yin Laia, 2010).
METHOD
The calculation of the number of colors can be processed by human eye resolution counting and software. Due to the limited range of colors that human eyes can resolve, the number of colors may be imprecise, resulting in a deviation of the results. Hence, in this experiment, the color number was computed by the implementation of MATLAB 2020a (https://nic.seu.edu.cn/fwzn/rjzbh/matlabz bh.html), based on the HSV values of each point on a page. If two points are of the same h value, then give them the same Numbers; if the h value is not the same, to give different Numbers to be used to differentiate (the Numbers are arranged in order).
The color area calculation is based on the MATLAB 2020a, with the concept of matrix in MATLAB. In the above we have given each pixel point a number, then we can calculate value given by the number, for example, if the color value of a particular color is 1, the area size of the corresponding color block can be obtained by computing the number of 1.
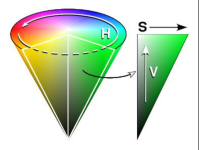
HSV color system, the greater the difference of two kinds of color, the greater the difference in the eyes of sensation. Therefore, we need to convert RGB values of color to HSV value calculation. The process is calculated using the HSV color system coordinates for a n-hexane (as shown in figure 1) in MATLAB 2020a. The color forms a cylinder. The hue varies from 0° to 360°, while the corresponding color changes from red to yellow, green, cyan, blue, magenta, and back to red. Saturation ranges from 0(unsaturated) to 1.0(com- pletely saturated). The value ranges from 0 to 1.0, and the corresponding color becomes brighter and brighter. The color distance between (H1, S1, V1) and (H2, S2, V2) is generally :(chien-yin Laia, 2010).
Equation reproduced from the original PDF.
4
(1) Two kinds of color can be obtained by the formula (1) in the HSV space distance. It can be regarded that the distance of two kinds of color, i.e. 1 C, the greater the gap, the more different between two kinds of color in people’s eyes; thus, the greater the gap, the page on color is more complex. But you
The Influence of Color on Web Page Complexity and Color Recommendation 305
can have multiple colors on a page, so you need to compute the sum in pairs, that is:
h X 1Cij−B (2)
Equation reproduced from the original PDF.
1Cij−B (3)
Equation reproduced from the original PDF.
2 (4)
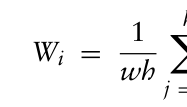
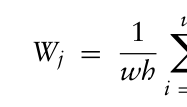
The color distance of the whole page can be obtained by combining the formulas (2), (3) and (4), where Wi, Wj is the average visual weights of all color pixel blocks in the i column and j row respectively, 1Cij−B is the color distance between a pixel block(ij) and the background, and the result W is normalized within [0,1], so as to facilitate the comparison of results.
Experimental Study Subjects: Twenty participants (10 males and 10 females) were recruited in this experiment. All participants had normal or corrected visual acuity and normal color vision. The mean age of the participants was 22 years old, ran- ging from 21 to 24 years old. They were asked to look at one page in turn and give the page a comment. Each participant spent 10-15 minutes for the whole experiment process.
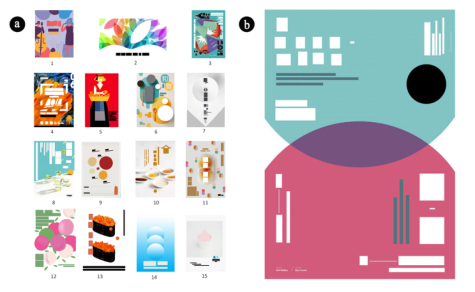
Materials: This experiment needs to evaluate different color number of pages. Images are collected from a website. After a large number of collection and analysis, 15 pages with obvious gaps were screened out (Figure 2a). After the processing of Photoshop software, the colors in the web pages is processed into color blocks to avoid the influence of other elements on the pages (each page includes a variety of color blocks of different sizes). Since it is difficult for users to evaluate individual pages, a moderately complex page should be selected as the benchmark graph (as shown in Figure 2b), and compared with other pages for scoring.
Procedure: This experiment was conducted in the Human Factor Lab at Southeast University. The participants sat calmly on a chair. Diffe- rent pictures were presented in the center of the computer screen, and participants were asked to rate them on a five-point Likert scale accor- ding to the pictures’ complexity. First, the participants were instructed to select the reference picture and score their corresponding complexity. Then, they were asked to compare and evaluate the reference image with other pages in turn. If the complexity of an image is higher than that of the base reference picture, a higher score was to be assigned to this image.
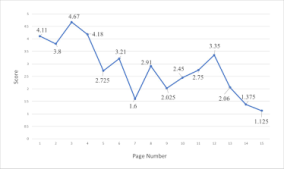
Figure 2: The pictures left and right are the experimental page materials and the refere- nce map respectively:(a) Participants were required to evaluate 15 pages in the picture. (b) This page is used as a reference, every page needs to be compared with it.Figure 3: The average web page complexity.
RESULTS
Experimental Results After the two hours of the experiment, the specific score of each participant for each page was obtained (the distribution of the score is between 1 and 5). Figure 3 below depicts the mean value of the measured data, which is the mean values of the ratings of all participants for the complexity of each page.
The mean values can be used for regression analysis to study the relation- ship between page complexity and individual color elements, and to analyze the relationship between complexity and three elements, namely multiple linear regression analysis.
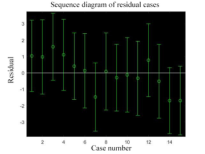
Data Analysis This section will analyze the regression relationship between the number of colors, color area and color distance and page complexity in turn. We will explore whether each factor is related to page complexity. After analyzing the result data with MATLAB 2020a, we found that the experimental data of the two factors of color number and area had high reliability and no data with large deviation. However, for the data of color distance, we found that the last data had large deviation and was abnormal data (see Figure 4). Therefore, after discarding the last data, regression analysis was conducted again and
The Influence of Color on Web Page Complexity and Color Recommendation 307
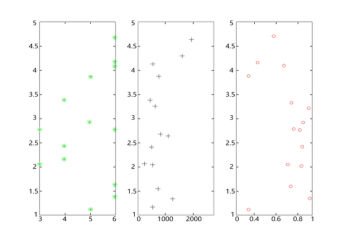
Figure 4: Unary linear analysis residual graph (Verify that the data is not too biased, from left to right: color, color area, and color distance, respectively).Figure 5: Scatter diagram (from left to right: color, color area, and color distance, respectively).
the data were found to be normal. The following formula of unary linear regression was obtained according to the data: Equations (5), (6) and (7) respectively represent the relationship betw- een the number of colors, color area and color distance and page complexity, where X represents three elements and Y represents page complexity.
Equation reproduced from the original PDF.
Y = 3.542 −1.041X3(X3 = W) (7) Through unary linear regression analysis, we found that the three elements are strongly correlated with page complexity and obtained the unary linear relationship between them. This can provide the basis for the future color design and provide a new solution for the color collocation.
From the scatter diagram (Figure 5), it can be seen that the complexity evaluation of the pages 5,6,8,9,10,11,12 is moderate, neither high or low. Such pages will make people feel comfortable. The color factors of these pages are as follows: [3, 6, 5, 3, 4, 6, 4], [1094, 393, 2356, 592, 393, 793, 753, 291], [0.782, 0.923, 0.875, 0.838, 0.851, 0.731, 0.707]. We can see from these data that the page complexity is moderate when the number of colors is between 3-6, the area is between 200-1100, and the color distance
is above 0.5. The larger the value is, the greater the page complexity will be. The following linear regression analysis was conducted for the three factors: Through the above scatter diagrams, it is found that there is a linear relationship between these three elements and page complexity, which is near a straight line. Therefore, formula (8) is obtained through software analysis.
Y = 2.311 + 0.159X1 + 4.595X2 −0.993X3 (8) X1, X2, X3, respectively represent the number of colors, color area and color distance. This formula can be utilized to assess how complex a page is, or we can use complexity to simply recommend color combinations.
CONCLUSION
These calculation methods are computed based on the element blocks. It is considered that each color block on a page is independent and does not affect each other. To increase the validity and reliability of the experimental results, we processed and analyzed the experimental data to gain more accu- rate results, combining with the calculation model to make color matching recommendations. This is also the practical significance of the current study. Therefore, in the design of the page, we should attempt to limit the number of colors to six. In addition, the color area should not be too large. Assu- ming that the area of each pixel point is 1, the average color area value of the whole page should be between 200 and 1100. According to the formula used to calculate the color distance, the larger the resulting color distance, the better the color balance. Thus, the recommended range is between 0.5 and 1, with a higher value indicating a better balance of the page, that is, moderate complexity and comfortable looking.
REFERENCES
Altaboli, A., & Lin, Y. 2011. Investigating effects of screen layout elements on interface and screen design aesthetics. Advances in Human-Computer Interaction, 10. doi:10.1155/2011/659758. Arnheim, R., 1974. Art and Visual Perception. University of California Press, Berke-
ley. Arnheim, R., 1988. The Power of the Center. University of California Press, Berkeley. Bauerly, M., Liu, Y., 2006. Computational modeling and experimental investigation of effects of compositional elements on interface and design aesthetics. International Journal of Human-Computer Studies 64 (8), 670–682. Chien-Yin Lai,2010. Computational models and experimental investigations of
effects of balance and symmetry on the aesthetics of text-overlaid images. Comaniciu, D., & Meer, P. 1997. Robust analysis of feature spaces: color image segmentation. In Proceedings of the IEEE Computer Society Conference on Computer Vision and Pattern Recognition, 750–755. De Angeli, A., Sutcliffe, A., Hartmann, J., 2006. Interaction, usability and aesthetics:
what influences users’ preferences? In: Proceedings of the Sixth ACM Conference on Designing Interactive Systems, PA, June 2006.
The Influence of Color on Web Page Complexity and Color Recommendation 309
Lee, S., & Koubek, R. J. 2011. The impact of cognitive style on user preference based on usability and aesthetics for computer-based systems. International Journal of Human–Computer Interaction, 27, 1083–1114. Michael Bauerly, 2006. Computational modeling and experimental investigation of
effects of compositional elements on interface and design aesthetics Paschos, G., 2001. Perceptually uniform color spaces for color texture analysis: an empirical evaluation. IEEE Transactions on Image Processing 10 (6), 932–937. Reiser, H., Reiser, B., 1995. Aesthetic considerations unique to interactive multime-
dia. IEEE Computer Graphics and Applications 15 (3), 24–28. Schmidt, K., Liu, Y., Sridvasan, S., 2009. Webpage aesthetics, performance and usability: design variables and their effects, Ergonomics 52 (6), 631–643. Zhou Lei,Xue Chengqi, 2013. The beauty evaluation method of interface element
layout design.
LISTED IN THE AHFE DIGITAL BOOKSTORE CATALOGUE
Explore the complete digital volume
Usability and User Experience
Read this individual research paper free through the original publisher, or explore the full digital proceedings book.
ISBN 978-1-958651-15-5
Explore this ISBN in the AHFE Bookstore ↗Listed in the July 2026 bookstore catalogue; search by ISBN to confirm current availability · Digital book purchase optional