Yusuke Osawa, Shohei Tawata, Keiichi Watanuki, Kazunori Kaede (2022). Prediction of health screening data with personal uncertainty using bayesian neural networks. In: Affective and Pleasurable Design. AHFE Open Access, vol. 41, pp. 120–128. https://doi.org/10.54941/ahfe1001788
In Japan, a specific health checkup has been conducted for people aged 40 and over since 2008. In the specific health checkup, public health nurses and dietitians provide health guidance according to the level of health based on the results of test values and questionnaire items. However, the content of the guidance for lifestyle improvement varies depending on the experience and judgment of the instructor. And the guidance is based only on the health checkup result report. Therefore, the evidence for lifestyle improvement is weak and does not lead to actual lifestyle improvement.In order to solve this problem, we have developed a system that predicts future test values based on past test values. In our previous research, we constructed a highly accurate model for predicting the next year's test values based on the past's health checkup test using a multichannel deep convolutional neural network, which is a type of machine learning. In addition, the features as the basis for the model's predictions were analyzed by sensitivity analysis in order to evaluate the validity of the predictions. However, there are the cases that some examinees may suddenly change their lifestyles, even if similar trends were observed in the previous year. In addition, even if the same health guidance was given in the previous year, the awareness of lifestyle improvement differ among individuals. In addition, even if the same health guidance was given in the previous year, the awareness of lifestyle improvement differ among individuals. The questionnaire includes items that ask about the awareness of lifestyle improvement, and these items have variations in the actual degree of lifestyle improvement among individuals. Thus, there is uncertainty in the prediction of test values for each examinee. In order to be convincing and safe, it is necessary considering the uncertainty of the previous year's data in predicting test values. The purpose of this study is to predict the test value considering the uncertainty of the test value due to the awareness of lifestyle improvement among examinees. A bayesian neural network (BNN) is a network that considers the weights in a neural network as random variables generated based on a certain probability distribution. We constructed a highly accurate BNN prediction model using the health checkup results concluding the basic data (age and sex), the test values of the past two years, and the results of questionnaire items as inputs, and the test values of the next year as outputs. The incidence of lifestyle diseases are predicted based on these diagnostic criteria using the BNN model outputs. In the future, we will compare the prediction of disease onset by the BNN model with that by the conventional neural network model using the actual diagnosis results of lifestyle diseases, and examine the explanatory of the two models.
The increase in lifestyle diseases, such as cancer and cardiovascular diseases, has led to challenges in increasing the healthy life expectancy and improving the quality of life in developed countries. Therefore, several measures aimed at national health promotion and disease prevention (Ministry of Health, Labor, and Welfare, 2021) have been introduced. One of these measures is providing specific health checkups and guidance for people aged 40 years and above, which was established in 2008 (Ministry of Health, Labor and Welfare, 2021). Herein, public health nurses and dietitians provide health
Prediction of Health Screening Data with Personal Uncertainty 121
guidance according to the examinee’s health level based on the test values and results of the questionnaire items. However, it is difficult to ensure impro- vements in lifestyle because the content of guidance varies depending on the experience and judgment of the lifestyle counselor. Moreover, the evidence for lifestyle improvement is weak as it relies only on the health checkup results.
Several studies have been conducted to analyze the status of diseases and medical costs, extract details of the examinees with a high risk of develo- ping diseases, and analyze the effects of health guidance using data from specific health examinations and medical receipts. Doi et al. (2012) con- structed a diabetes risk-scoring model based on the coefficients of the Cox proportional-hazards model. Their study considered important risk factors, such as age, gender, family history of diabetes, abdominal circumference, body mass index, presence of hypertension, regular exercise, smoking, and fasting blood glucose levels to identify individuals at high risk of developing type 2 diabetes. Tsutatani et al. (2017) constructed a model for predicting the onset of metabolic syndrome and hypertension using the Cox proportional- hazards model based on the lifestyle items of a questionnaire in the specific health checkup; they investigated the relationship between different items. Sasaki et al. (2019) proposed a Bayesian network model for predicting the onset of type 2 diabetes within three years using medical receipt data, que- stionnaire data from specific health checkups, and blood glucose test data. In addition to the aforementioned studies, the medical costs associated with lifestyle diseases have been investigated. Hasegawa et al. (2020) developed a medical cost prediction model based on the Bayesian network using medical receipt and specific health checkup data.
Typically, models for predicting the onset of diseases require a large amount of training data from examinees who are affected by those diseases. However, we have been developing a system to predict future test values based on past test values. Previously, we constructed a model for predicting the test values of the subsequent year based on the past specific health checkup data using a multichannel deep convolutional neural network (MC-DCNN) (Osawa et al. 2021). However, despite considering a group of examinees with identical tendencies in the previous year, certain examinees unexpectedly changed their lifestyle habits. Additionally, although the same health guida- nce was provided in the previous year, individual differences were observed in terms of lifestyle improvement awareness. Therefore, uncertainty exists in the prediction of test values for each examinee. To ensure persuasiveness and safety, it is necessary to consider the uncertainty of the data from the previous year to predict the future test values. The objective of this study is to construct a test-value prediction model that considers the uncertainty of test values based on the examinees’ awareness of lifestyle improvements and discuss its effectiveness.
ACQUISITION AND PRE-PROCESSING OF SPECIFIC HEALTH CHECKUP DATA We obtained the specific health checkup data of 15 559 subjects in the years 2008–2020 from two medical institutions. The data from each specific
Table 1. Items of basic information about examinees.
Table available in the original PDF paper.
1 Gender 2 Year of birth
Table 2. Items of test values and blood collection time.
medical checkup were anonymized to protect the identities of the individuals. The data comprise 2 items of basic information about the examinee, 14 items of test values and the time of blood collection, and 22 items of the question- naire. However, a few questionnaire items were modified in 2018. Tables 1, 2, and 3 list the items in the specific health checkup data before and after 2018. These data were pre-processed to be used as input or output data for mach- ine learning. Ideally, machine learning should be performed using only the data after 2018, which include information after the change in questionnaire items. However, this provides an extremely small number of data points. Therefore, we used the data before and after 2018, excluding the results of questionnaire items 13 and 16. Although items 21 and 22 of the que- stionnaire pertained to the awareness of lifestyle improvement, the results of these responses were considered to be less reliable than those of other items. For instance, a person who smokes and drinks alcohol daily with no intention of quitting can provide a false answer of “Yes” if asked, “Do you want to improve your lifestyle habits, such as exercise and diet?” As mentioned earlier, this study aimed to consider such uncertainties caused by individual differences in awareness of lifestyle improvements. An item was considered an important feature if its reliability was high. However, this may impact machine learning negatively if the item contains numerous false answ- ers. Therefore, the results of items 21 and 22 were excluded from this study. The data for three consecutive years of specific medical checkups were extra- cted. However, the data of the examinees without the results of the checkup for three years were excluded. Additionally, the data of the examinees who underwent checkups for four or more consecutive years were divided by sli- ding the division window for three years. The frequency of visits to the same medical institution was not consistent among examinees, and certain data existed with large intervals between visits. Therefore, we excluded the data with intervals of less than 0.5 and more than 1.5 years between the previous and subsequent visits. Furthermore, data with missing values for any of the items were excluded. Finally, the questionnaire results were quantified using
Prediction of Health Screening Data with Personal Uncertainty 123
Table 3. Questionnaire items.
Table available in the original PDF paper.
1 Taking medication to lower blood pressure
13 Before March 31, 2018: weight change of at least ±3 kg over a period of one year 2 Taking insulin or blood sugar-lowering medication
14 Eating faster than others
After March 31, 2018: chewing frequency during meals 3 Taking cholesterol-lowering medications 4 History of stroke (cerebral hemorrhage, cerebral infarction, etc.)
15 Eating within 2 h before bedtime at least three times a week 5 History of heart disease (angina pectoris, myocardial infarction, etc.)
16 Before March 31, 2018: eating a snack after dinner at least three times a week 6 History of developing chronic renal failure
After March 31, 2018: eating snacks in addition to breakfast, lunch, and dinner 7 History of developing anemia 17 Skipping breakfast at least three times a week 8 Habitual smoking 18 Frequency of drinking alcohol 9 Weight gain of more than 10 kg since the age of 20 years
20 Being well-rested from sufficient sleep
19 Amount of alcohol consumed per day on drinking days 10 Exercise for at least 30 min twice a week for at least one year
11 Walking or equivalent physical activity for at least 1 h per day
21 Willingness to change lifestyle habits, such as exercise and diet 12 Walking slower than the same gender of approximately the same age
22 Willingness to receive health guidance on lifestyle improvement
the response numbers. Owing to these pre-processing steps, we obtained 18 886 matrices comprising 2 basic information items and 32 test values and questionnaire items × 3 years.
MODEL FOR PREDICTING LABORATORY VALUES USING BAYESIAN NEURAL NETWORK Bayesian Neural Network (BNN)
In a neural network (NN), each weight or bias is a single value. By contrast, BNN treats them as random variables. The probability distribution in BNN contains weights and biases that follow and perform a prediction in the same flow as that in the NN by probabilistically sampling the weights and biases once. By executing this process an arbitrary number of times, a probability- distributed prediction can be obtained for the same input. The BNN model is trained to update the parameters of the probability distribution that is follo- wed by each weight or bias. The probability distributions of the weights and biases facilitate the expression of the uncertainty in the predictive ability of the model. However, uncertainty exists in the output as well, caused by the input; this can be expressed by a single network with its head split to pre- dict mean as well as variance (Kendall and Gal, 2017). As BNN can suppress over-learning and handle the uncertainty of prediction quantitatively, it can be applied to the prediction of test values using specific health checkup data as input. These predictions are performed considering the uncertainty caused by individual differences in the awareness of lifestyle improvement-related diseases among examinees.
Table 4. Percentages of mean absolute error of the mean of the output probability distribution of each item for all test data relative to the true value.
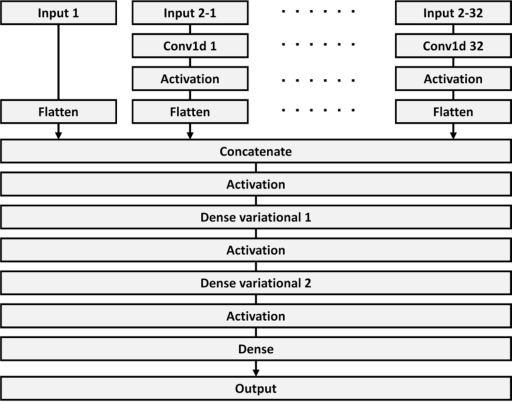
Figure 1 depicts the machine learning model constructed by combining an MC-DCNN and BNN. The first half of the model comprises the convolu- tion segment corresponding to each variable of the input data, whereas the second half includes the BNN segment, which considers the data that unify the convolution segment as input. The inputs are the data from the first and second years of the matrix obtained from the test results of three years. Input 1 represents gender and year of birth, and Input 2-1 to Input 2-32 represent the 32 items of the test values and results of the questionnaire items, respecti- vely, from which the excluded items were removed. Additionally, output was defined as the difference in each of the 13 test items between the second and third years. Both input and output data were normalized using the Z-score for each item. In the intermediate layers, “Conv1d” represents one-dimensional (1D) convolution; “Flatten” represents conversion to a 1D array; “Conca- tenate” indicates concatenation of arrays; “Dense variational” represents a fully connected layer where weights and biases are random variables; and “Dense” represents a fully connected layer with fixed weights.
We divided the 18 886 data points into training data (13 600), validation data (3400), and test data (1886); the model was evaluated using the holdout method. We used negative log-likelihood as the loss function and Adam opti- mization with a learning rate of 10-3. The hyperparameters were searched using Bayesian optimization. The search items included the number of filters in Conv1d and that of units in Dense variational 1 and 2; the number of sea- rches was set to 10. Owing to optimization, the number of filters in Conv1d was two, and the number of units in Dense variational 1 and 2 were 2 and 32, respectively. Additionally, the sigmoid function was applied to all activation functions. The number of epochs was set to 300 for the final training, and the model was adopted at the time when the validation data loss was minimal.
Table 4 summarizes the percentages of the mean absolute error of the mean of the output probability distribution of each item for all test data relative to the true value; their mean value was 13.11%. Additionally, the test data are not necessarily the average of a group of comparable data. Therefore, we calculated the percentage of true values within the 90% confidence interval of the output probability distribution for the test data. The results presented
Prediction of Health Screening Data with Personal Uncertainty 125
Figure 1: Structure of the Bayesian neural network (BNN) test-value prediction model.Table 5. Percentage of true values within the 90% confidence interval of the output probability distribution for the test data.
in Table 5 indicate that the average proportion of true values included in the output probability distribution for all test values was 92.76%.
DISCUSSION
Increasing the Lifestyle Improvement Awareness by Predicting the Onset of Lifestyle Diseases During validation, we determined the error between the mean of the out- put probability distribution and true value. Additionally, the percentage of the true value within the 90% confidence interval of the output probabi- lity distribution was calculated. In actual operations, the output probability distribution can be used to provide lifestyle improvement guidance to the examinees. The error between the mean and true value included items with large errors, such as “Neutral fat.” Conversely, the percentage of true values included in the 90% confidence interval was high for all items. Therefore, the results verify that the health checkup data contain uncertainty of the sub- sequent year’s test values, and the test data are not necessarily a dataset that
Table 6. Diagnostic criteria for the metabolic syndrome.
Table available in the original PDF paper.
Items Threshold
≥150 mg/dL <40 mg/dL
Required Girth of the abdomen Male: ≥85 cm Female: ≥90 cm Choice Hypertriglyceridemia and/or Low HDL-cholesterol ≥130 mmHg ≥85 mmHg Maximum blood pressure and/or Minimum blood pressure
Fasting blood sugar ≥110 mg/dL
exhibits average results. The BNN test-value prediction model can consider such uncertainties. Furthermore, the diagnostic criteria were established for each lifestyle disease; Table 6 lists the criteria for the metabolic syndrome. Therefore, the output probability distribution can quantitatively indicate the probability of the examinees suffering from metabolic syndrome in the sub- sequent year, which is expected to motivate the examinees to improve their lifestyles.
Limitations of the Study The accuracy of the mean value of the distribution output by the BNN test-value prediction model was 13.11%, with the “BMI,”“Girth of the abdo- men,” and “Hb A1c”items exhibiting particularly high accuracy, whereas the “Neutral fat,” “GPT,” and “γ - GPT” items had low accuracy. The proposed model outputs each of the 13 test values in a single attempt. During training, as the model adjusts each parameter to minimize the average loss of all items, the optimized parameter need not be determined for each item. Therefore, the model builds a prediction model for each item to learn the corresponding optimized parameters, which improves the overall accuracy.
In machine learning, highly accurate inference exhibited by a model may be attributed to learning features that cannot be explained by actual physical or physiological phenomena. Therefore, it is important to evaluate the model’s validity of the learning. In recent years, several methods have been proposed to analyze the features learned by machine learning models. Sensitivity analy- sis, which is the most basic feature analysis method, calculates the gradient for each element of an arbitrary layer (primarily the input layer) relative to the output of the output layer. Elements with higher gradients contribute more to the determination of the output. In the proposed BNN model, the mean and standard deviation of the probability distribution served as the output of the output layer. The gradient of the input elements calculated against the mean indicated the contribution of each element of the input to the determination of the predicted value, similar to the sensitivity analysis of the NN model. The gradient against the standard deviation indicates the degree of influence on the data variability, indicating the reliability of the item. For instance, items 21 and 22 that were excluded from the study ask about the awareness of lifestyle improvement. In the case of “I do not intend to change my lifestyle,” the variability is small owing to the slight possibility that the answer may be false, whereas in the case of “I intend to change my lifestyle,” the variability
Prediction of Health Screening Data with Personal Uncertainty 127
is large because the possibility of the answer being false is high. Therefore, the gradient of this item with respect to the standard deviation is expected to be large, indicating the reliability of the item. In the future, we intend to per- form a sensitivity analysis on the mean and standard deviation of the output probability distribution of the BNN test-value prediction model to evaluate the validity of the model and reliability of the input items.
This study considered the data from 2008 to 2020 to ensure a sufficient amount of data, excluding questionnaire items 13 and 16, which were chan- ged. However, questions 13 and 16 in 2018 and later were questions about chewing and snacking, respectively. These questions have a significant effect on test values, such as the girth of the abdomen. Therefore, it is necessary to collect long-term data and develop a machine learning prediction model using only the data from 2018 onwards.
CONCLUSION
The objective of this study was to predict test values using specific health checkup data, considering the uncertainty caused by individual differences in the awareness of lifestyle improvement among examinees. We developed a probability distribution prediction model using MC-DCNN and BNN with two basic data items, thirteen test items and blood collection time, and eigh- teen questionnaire items as inputs for the previous two years. In terms of model accuracy, the error of the mean of the predictive probability distribu- tion against the true value was 13.11%. The proportion of true values within the 90% confidence interval of the prediction probability distribution was 92.76%, and a highly accurate prediction was possible. These results indicate that the obtained health examination data contain uncertainty about the sub- sequent year’s test values, and the probability distribution can be predicted considering these uncertainties. Furthermore, the diagnostic criteria for life- style diseases were clearly defined. Therefore, by predicting the probability distribution of each test value using this method, lifestyle diseases that may occur in the future can be predicted. Consequently, patients can be examined and provided uniform guidance regardless of the lifestyle counselor.
ACKNOWLEDGMENT
The authors would like to acknowledge the support provided by the Saitama City Task Force for R&D Human Resource Development in cooperation with HIT Co. We also thank the medical institutions that provided the specific health checkup data.
REFERENCES
Doi, Y., Ninomiya, T., Hata, J., Hirakawa, Y., Mukai, N., Iwase, M., and Kiyohara, Y. (2012). Two risk score models for predicting incident Type 2 diabetes in Japan, Diabetic Medicine Volume 29 No. 1, pp. 107–114.
Hasegawa, Y., Miyosi, T., Tarumi, S., Osaki, T., Ban, H., Negishi, M., and Kunichika, N. (2020). Health Service Planning Support System Based on Medical Costs Prediction of Chronic Diseases Using Bayesian Network, The Institute of Electro- nics, Information and Communication Engineers Volume Volume J103-D No. 11, pp. 829–838. (in Japanese). Kendall, A. and Gal, Y. (2017). What uncertainties do we need in bayesian deep
learning for computer vision? Advances in neural information processing systems 30, (NIPS 2017). Ministry of Health, Labor and Welfare (July 20, 2021). Reference materials on the promotion of Health Japan 21 (the second stage). Website: https://www.mhlw.g o.jp/bunya/kenkou/dl/kenkounippon21_02.pdf. (in Japanese). Ministry of Health, Labor and Welfare (July 20, 2021). Standard health checkup and
health guidance program, 2018 version. Website: https://www.mhlw.go.jp/conte nt/10900000/000496784.pdf. (in Japanese). Osawa, Y., Watanuki, K., Kaede, K., and Tawata, S. (2021). Prediction of test values using machine learning based on specific health checkup data, Proceeding of 2021 Mechanical Engineering Congress, Japan. (in Japanese). Sasaki, K., Kuno, S., and Okada, Y. (2019). Community health prediction using
Bayesian networks, Communications of the Operations Research Society of Japan Volume 64 No.7, pp. 399–405. (in Japanese). Tsutatani, H., Fnamoto, M., Sugiyama, D., Kuwabara, K., Miamatsu, N., Watanabe, K., and Okamura, T. (2017). Standard health checkup and health guidance pro- gram, fiscal year 2008 version, Nihon Koshu Eisei Zasshi (Japanese Journal of Public Health) Volume 49 No. 5, pp. 258–269. (in Japanese).
LISTED IN THE AHFE DIGITAL BOOKSTORE CATALOGUE
Explore the complete digital volume
Affective and Pleasurable Design
Read this individual research paper free through the original publisher, or explore the full digital proceedings book.
ISBN 978-1-958651-17-9
Explore this ISBN in the AHFE Bookstore ↗Listed in the July 2026 bookstore catalogue; search by ISBN to confirm current availability · Digital book purchase optional