Su Wutyi Hnin, Amna Javed, Jessada Karnjana, Chawalit Jeenanunta, Youji Kohda (2022). Impact of COVID-19 pandemic on electricity load demand in Thailand. In: The Human Side of Service Engineering. AHFE Open Access, vol. 62, pp. 176–182. https://doi.org/10.54941/ahfe1002556
Electricity demand is typically affected by many exogenous and endogenous factors to which utility generation, transmission, and distribution systems respond accordingly. The outbreak of COVID -19 caused a sudden change in every aspect in many countries. The number of cases increased exponentially from mid-March 2020 in Thailand. The Thai government has taken many pandemic-prevention measures such as requiring people to stay home to reduce human-to-human transmission of the virus. Many human activities stopped, such as businesses, services, and transportation. The preventive measures taken to curb the spread of COVID -19 have drastically changed the behavioral patterns of people. The energy sector is one of the sectors most affected by COVID-19. After the government-imposed restrictions to prevent COVID -19 within the country, there were extreme fluctuations in demand for electricity on the grid. We compared the electricity load patterns before and after introducing the countrywide restrictions by the government. Electricity Generating Authority of Thailand provided the daily 30-minute load data. This study provides valuable insights into the Thai power system during the global crisis. This is to support decision making, especially for policy-makers, grid operators, and regulators, by quantifying the short-term impact and identifying the long-term impact of pandemic waves on the power system.
Thailand: Case in Perspective A novel 2019 coronavirus disease was officially identified in Wuhan, China, in December 2019. This new coronavirus, SARS-CoV-2, causes severe acute respiratory syndrome (COVID-19), spreading to all countries. WHO (World Health Organization) declared that COVID-19 was a pandemic on March 11, 2020, because it had swept into at least 114 countries and killed more than 4000 people (Chappell Bill, 2020). Thailand was the first to report a case outside China on January 13, 2020 (Elizabeth Cheung, 2020). The number of cases increased tremendously during the first phase from March 26 to May
Impact of COVID-19 Pandemic on Electricity Load Demand in Thailand 177
2020 due to the lack of awareness of the new virus. Therefore, the govern- ment was forced to act and implement a lockdown policy, closing schools, nightclubs, and other public places. Closed airports and travel restrictions forced employees to work from home. The government also imposed a cur- few. Due to a new cluster emanating from large migrant workers in Samut Sakhon, Phase 2 occurred between January and March 2021. Phase 3 began in April 2021 with an infection cluster from clubs in Thong lo, followed by another phase (Ketudat and Jeenanunta, 2021). The government then retur- ned to the restriction measures. Thus, electricity demand suddenly dropped below the usual load. Due to the rapid electricity consumption changes during pandemics, electricity power overproduction occurs (Amritha Pillay, 2020). Sudden changes in electricity consumption make it difficult to manage ele- ctrical energy usage. We examined Thailand’s electricity load demand during the lockdown through load curves. We focused on the potential causes of uncertainties, offsets, and energy savings based on the load factor (LF).
Background of Thailand Energy Sector Thailand has a well-developed energy sector built on oil and natural gas. Ninety percent of Thailand’s electricity generation is conventional thermal, e.g., oil and coal. Oil-fired plants have been replaced with natural gas, which generated 65% of Thailand’s load demand in 2018. Coal-fired plants sup- ply another 20%, with the remainder coming from hydropower, biogas, and biomass. As of May 2018, The Electricity Generating Authority of Thailand (EGAT) supplies 37% of Thailand’s load demand, independent power pro- ducers 35%, small power producers 19%, and electricity imports 9%. In 2015, Thailand’s Power Development Plan (TPDP) for (2015–2036) released its new strategies, targets, and policies for the next 20 years. The plan inclu- ded energy-saving programs and energy-efficiency promotions to reduce the country’s total electricity demand by 25% within the next 20 years. From 2015 to 2036, they plan to increase the use of alternative energy by 25%. To make the next 20 years’ policy, they forecast the total electricity load demand for 2026. EGAT’s power-generation plants consist of 3 thermal- power plants, 6 combined cycle power plants, 24 hydropower plants, 8 renewable-energy plants, and 4 diesel-power plants. Gas-fired generation powers 67% of EGAT’s electricity generation, while coal-fired power plants account for 20%. Most of EGAT’s electricity is sold to the Metropolitan Electricity Authority (MEA), which supplies the Bangkok region, and the Provincial Electricity Authority (PEA), which provides the rest of Thailand.
Load-Profile Characteristics The load profile or load curve shows the electrical load variation versus time. The daily load pattern changes depending on many factors such as holidays, bridging holidays, temperature, and types of customers. The load-duration curve identifies the load variation during different hours of the day and indi- cates the peak load that determines the maximum demand of the power station. Many statistical calculations can be carried out for the load curve to gain detailed insight into the overall system.
Load-Profile Classification The load profile can be classified into three types by the measurement dura- tion. The first type is the daily load curve, which is 48 periods for the 24-hour duration, and denoted as Li, where i = 1, 2, . . . ,48 periods. The second type is the weekly load curve, a 7-day period, denoted as Li,d, where i = 1, 2, …, 48 and d = 1, 2, …, 7 days of the week. This load profile can compare between weekdays and weekends, where the latter is a lower load. The third type is the monthly load curve, which is for the length of the interest’s month and is also denoted as Li,m where i = 1, 2, …, 48 and m = 1, 2, …, n days of the month.
Parameters for Characterizing Load Profile By examining the load ranges Li,m where i = 1, 2, …, 48 periods and m = 1, 2, …, n day of preference, characteristics parameters are determined, including peak load, average load, LF, and power ratio.
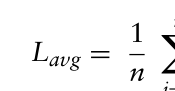
Equation (1) shows the average electrical load of day j, Lavg:
n X
Equation reproduced from the original PDF.Equation reproduced from the original PDF.
Equation (2) shows peak electrical load Lpeak:
Lpeak = max {Li, 1 < i < n} , (2) where n is the number of periods in a day. The LF is the ratio of average electrical load over a given period to peak electrical load (maximum demand) occurring in that period for measuring the utilization rate or usage efficiency. The LF plays an important role in the cost of generation per unit. The higher the LF, the higher the efficiency of the system (McLoughlin et al., 2012)
(3)
LF = Lavg Lpeak
The peak-to-average power ratio (PAPR) is the inverse of the LF and is evaluated from the demand response perspective. These factors from the load curve provide more understanding of the electricity grid (Technische Hogeschool Delft et al., n.d.).
METHODOLOGY AND RESULTS Comparison of Net Peak Load Patterns
The EGAT provided the daily load curves of the Thailand power system. March and April 2020 were chosen as the timeframe of interest since the government emergency lockdown started the third week of March. The load curves from 2020 were compared with those from 2019 and 2021.
Impact of COVID-19 Pandemic on Electricity Load Demand in Thailand 179
Figure 1: Demand load curve comparisons: 2019, 2020, and 2021.Figure 2: March and April average load-demand comparisons: 2019, 2020, and 2021.
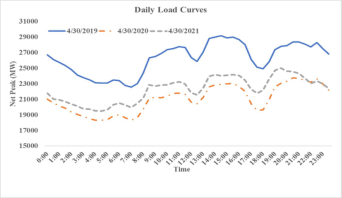
Due to the impact of COVID-19, the daily load curve changed significantly, as shown in Figure 1. The load on April 30, a weekday in all three years, was chosen to compare the load patterns. The load demand in the daytime was higher than at nighttime in 2019. In 2020, the daytime load was lower than nighttime due to countrywide lockdown and curfew. The curfew was from 10 pm to 4 am, starting on April 3, 2020, and ending on June 15, 2020. The load demand was lower in 2021 than in 2019 but higher than in 2020. It was not a lockdown across the country, but schools and other businesses, including gymnasiums, were forced to close for two weeks in mid-April 2021.
The average load-demand comparison for 2019, 2020, and 2021 are shown in Figure 1. Two months (March and April) were selected to com- pare the yearly load demand since the lockdown started in the third week of March 2020. The average load demand in 2020 and 2021 dropped by about 8% and 2%, respectively, to 2019. The load demand in 2020 significantly dropped. However, that in 2021 differed in the daytime only.
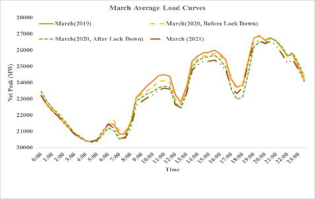
The monthly average load demand is shown in Figure 2 for March and April of these three years, respectively. There are four load curves for March each year. The countrywide lockdown started on March 26, 2020. Therefore, there are two load curves for March 2020, i.e., before and after lockdown. The average demand in March 2020 was greater than that of March 2019 because despite having a known case of COVID-19 earlier in March 2020, the closure of industrial and commercial businesses was not ordered until March last week. Therefore, this is a normal condition. The average load demands in April 2020 and 2021 declined compared to 2019. See Figure 2.
Table 1 lists the weekly average load-demand changes in percentages in March and April from 2019 to 2020 and 2021. The same load-demand
Table 1. Weekly load-demand changes in March and April 2019, 2020, and 2021.
Figure 3: Business and residential sector load-demand comparisons: 2019, 2020, and 2021.
pattern of days is compared for precise analysis. The first two weeks of March 2020 showed natural load demand increasing. When the lockdown started on March 26, the load demand changed suddenly, dropping by 3% in 2019. April second week is Thailand’s New Year holidays (Songkran Holidays). Usually, the load demand on these days is very low since people travel outside and businesses are closed. However, the load demand in 2020 increased by around 4% because people could not go out due to a nationwide lockdown. Despite this, the load demand continued to decrease each day in 2020. In 2021, the load demand decreased during April’s partial lockdown of the last two weeks.
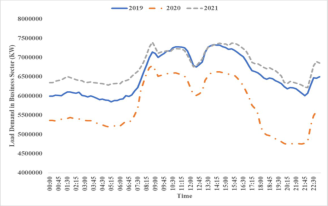
Electricity-Consumption Characteristics The electricity-consumption data can be found on the PEA website(“PEA”). The weekday load demand of April was chosen to compare 2019, 2020, and 2021. Two customer types were selected to better understand before and during the pandemic. Figure 3 shows the load demand of the business sector for April in the three years. The load demand in April 2020 declined by about 12% of 2019 due to the lockdown. However, the load demand in April 2021 increased by about 4% that of 2019. There was no lockdown in the first two weeks of April, and schools and some businesses, such as gyms, were closed. Large factories and some companies returned to regular operation.
Regarding the load demand for the residential sector (Figure 3), 2020 and 2021 were higher than 2019 because many people stayed home. Due to the curfew in 2020, the load at nighttime peaked in the three years. The daytime load in 2021 was the highest of the three years due to working from home. The average increased percentage in April 2020 and 2021 was 7 and 4%.
Impact of COVID-19 Pandemic on Electricity Load Demand in Thailand 181
Operational Statistics The LF is used to measure the efficiency of electrical energy usage and is always less than one because the average load demand will always be less than the maximum load demand. The monthly average LFs of April 2019, 2020, and 2021 were 79, 78, and 75%, respectively. The LF is useful in describing the electricity-consumption characteristics over a certain period. A high LF means electrical energy is used more efficiently (Roberts et al., 2019).
CONCLUSION
The COVID-19 pandemic has led to the global health crisis and economic gridlock and has directly impacted the power grid. The load curve over three years was compared to analyze the exact reason. The net peak load of EGAT and two types of loads of customers were selected for analysis. The main results are as follows: (1) EGAT’s net peak load demand in March and May 2020 and 2021 was affected by COVID-19, i.e., a decrease by about 8 and 2%, respectively, compared with that in 2019. (2) According to PEA, load demand in the business sector dropped significantly to 12% in April 2020 compared to 2019. However, in April 2021, load demand increased by about 4%. (3) Load consumption in the residential sector increased slightly by 7 and 4% in April 2020 and 2021, respectively. (4) The load factor in April 2021 decreased slightly, making people aware of electrical energy savings. The load forecast was affected in 2020 because the load increased and decreased significantly.
Therefore, the utility companies need to adopt qualitative forecasts to adjust their current forecasts to match the national crisis. The special event also should be considered in the current forecast. The yearly “trend” of electricity consumption does not increase due to the economic slow- down. Nonetheless, the reduction in load consumption has resulted in a positive sustainability impact. The business changes the consumption pat- tern. The daily consumption pattern also changes. So, the household con- sumption pattern also changes. As mentioned earlier, consumption in the residential sector increased slightly. Since households pay their electricity bills, there is not much energy waste in the residential sector compared to the business sector. Consistent with the increased percentage margin in the business sector in 2021, policymakers, grid operators, and regulators should begin to plan for energy savings in the workplace to ensure long- term energy use. Long-term plans and justifications should be focused on each region/country. The following open questions are worth exploring for future research: How will national incentives affect long-term energy recovery? Will energy-related sustainable development goals be reset (Mar- teleto et al., 2020) or remain in place by incorporating new implementation strategies?
ACKNOWLEDGMENT
This research is supported by the Japan Advanced Institute of Science and Technology (JAIST) and the National Science and Technology Development
Agency (NSTDA). In addition, it is also supported by the Center of Excel- lence in Logistics and Supply Chain Systems Engineering and Technology (COE LogEn), Sirindhorn International Institute of Technology, Thammasat University.
REFERENCES
Amritha Pillay, 2020. Covid-19 crisis: Lockdown knocks power use down 20–40% in some cities. URL https://www.business-standard.com/article/economy-poli cy/lockdown-knocked-power-consumption-down-by-up-to-40-in-large-cities- 120061800951_1.html (accessed 2.10.22). Chappell Bill, 2020. Coronavirus: COVID-19 Is Now Officially A Pande- mic, WHO Says. URL https://www.npr.org/sections/goatsandsoda/2020/03/ 11/814474930/coronavirus-covid-19-is-now-officially-a-pandemic-who-says (accessed 2.10.22). Elizabeth Cheung, 2020. Wuhan pneumonia: Thailand confirms first case of
virus outside China. URL https://www.scmp.com/news/hong-kong/health-envir onment/article/3045902/wuhan-pneumonia-thailand-confirms-first-case (acces- sed 2.10.22). Ketudat, S., Jeenanunta, C., 2021. Impact of the COVID-19 pandemic on logistics firms and their resilience: Case studies in Thailand. Engineering Management in Production and Services 13, 86–98. https://doi.org/10.2478/emj-2021-0023 Marteleto, L.J., Guedes, G., Coutinho, R.Z., Weitzman, A., 2020. Live Births and
Fertility Amid the Zika Epidemic in Brazil. Demography 57, 843–872. https://do i.org/10.1007/s13524-020-00871-x McLoughlin, F., Duffy, A., Conlon, M., 2012. Characterising domestic electricity consumption patterns by dwelling and occupant socio-economic variables: An Irish case study. Energy and Buildings 48, 240–248. https://doi.org/10.1016/j.en build.2012.01.037 PEA, n.d. URL http://peaoc.pea.co.th/loadprofile/en/ (accessed 2.14.22). Roberts, M.B., Haghdadi, N., Bruce, A., MacGill, I., 2019. Characterisation of
Australian apartment electricity demand and its implications for low-carbon cities. Energy 180, 242–257. https://doi.org/10.1016/j.energy.2019.04.222 Technische Hogeschool Delft, IEEE Industrial Electronics Society, Institute of Electrical and Electronics Engineers, n.d. 2020 IEEE 29th International Symposium on Industrial Electronics (ISIE): proceedings: 17–19 June, 2020, Delft, Netherlands. Thailand’s power development plan, 2015.
LISTED IN THE AHFE DIGITAL BOOKSTORE CATALOGUE
Explore the complete digital volume
The Human Side of Service Engineering
Read this individual research paper free through the original publisher, or explore the full digital proceedings book.
ISBN 978-1-958651-38-4
Explore this ISBN in the AHFE Bookstore ↗Listed in the July 2026 bookstore catalogue; search by ISBN to confirm current availability · Digital book purchase optional