Sarah Schwindt, Paula Von Graevenitz, Bettina Abendroth (2023). Situational Awareness in the Context of Automated Driving - Adapting the Situational Awareness Global Assessment Technique. In: Human Factors in Transportation. AHFE Open Access, vol. 95, pp. 161–171. https://doi.org/10.54941/ahfe1003802
Automated vehicles offer the opportunity to disengage from the driving task, though in SAE Level 3 vehicles a Take-Over Request (TOR) can occur at any time. In this case, the driver must quickly assess the situation and completely take over the driving task. In order for the driver to be able to do this safely, the rapid development of sufficient situational awareness is of particular importance. To investigate how this can be supported, it is necessary to find a sufficiently accurate method for measuring situational awareness in the context of automated driving. The Situation Awareness Global Assessment Technique (SAGAT) provides an objective, direct method for measuring all three levels of situation awareness. However, in previous applications of the method, the relevance of the information measured by the SAGAT method was not taken into account. The aim of this paper is therefore to first identify suitable SAGAT questions by means of a literature review and then to assess the relevance of the information asked for the safe takeover of vehicle control by an online questionnaire (n = 78). Subsequently, a study in a driving simulator (n = 32) will test whether a weighted evaluation of the SAGAT questions according to the classification by the online questionnaire can further optimize the method for measuring situation awareness.
INTRODUCTION AND AIM OF THE STUDY Automated vehicles with SAE Level 3 (SAE, 2021) allow the driver to disen- gage from the driving task and therefor concentrate on other activities such as reading, texting or listening to music (SAE, 2021). However, a Take-Over Request (TOR) can occur at any time, requiring the driver to quickly shift attention from the non-driving activity to the driving task and then fully take over the control of the vehicle. Problematically, such TORs often occur in complex situations, such as a lane change due to roadwork or an accident, making it even more challenging for drivers to take over (Kurpiers et al., 2020). Previous studies have generally assumed that a time budget of about eight seconds is given to regain control (Zhou et al., 2022). However, the study of Merat et al. (2014) shows that up to 40 seconds are required to
regain full control of the vehicle. Therefore, the question arises if drivers who have not focused on their surroundings for a longer period of time are able to sufficiently comprehend a complex situation within an eight-second time budget to safely take back control of the vehicle.
In order to investigate how they can be supported in this process, it is first important to find a method to measure situation awareness in the context of automated driving with sufficient accuracy. Regarding this, the Situa- tion Awareness Global Assessment Technique (SAGAT) developed for the use within simulated environments by Endsley (1988) provides an objective and direct method for measuring all three levels of situation awareness: Perce- ption, Comprehension and Projection of the situation. In this technique, the visual simulation is paused unannounced at a certain point and questions are asked about the driving situation experienced immediately before. The more questions are answered correctly, the higher the measured situational awa- reness. When using SAGAT, questions are often asked about aspects of the environment that are seemingly unimportant for the action to be performed. For example, when measuring situational awareness with SAGAT immedi- ately after a TOR, knowledge of the color of the billboard on the side of the road is rated as important for situation awareness as knowledge of the maneuver of the vehicle in front.
Therefore, the aim of this work is first to identify suitable SAGAT que- stions for possibly occurring TOR scenarios for automated vehicles with SAE Level 3 and then to test whether a weighted evaluation of the SAGAT questions with regard to their relevance for the action to be subsequently performed in the respective scenario can further optimize the method for recording situational awareness.
METHODOLOGY
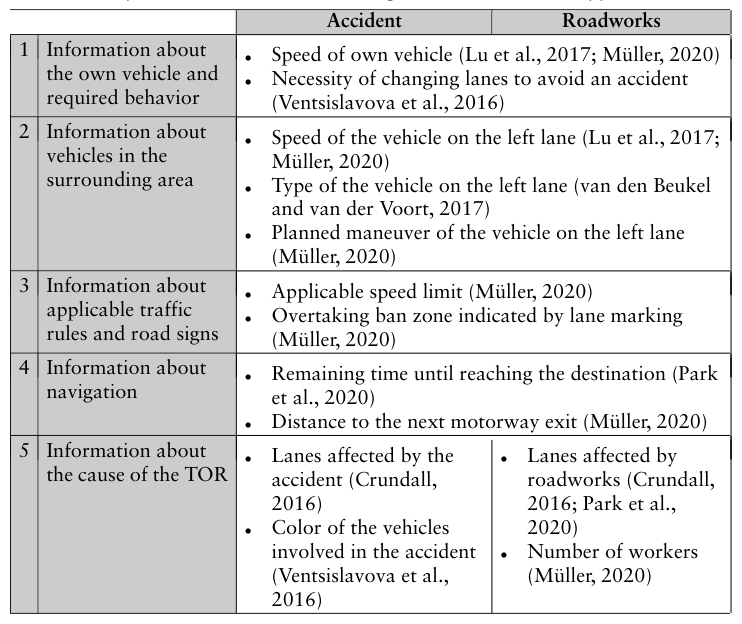
Literature Research and Online Survey To identify potentially relevant SAGAT questions, a systematic literature rese- arch on SAGAT use in the context of automated driving was conducted. Since in the studies found a lane change due to roadworks (e.g. van den Beukel and van der Voort, 2017) or an accident (e.g. Lu et al., 2017; Park et al., 2020) was often given as the reason for a TOR, these two scenarios were selected for the planned study in the driving simulator. The information requested in the identified studies (Crundall, 2016; Lu et al., 2017; Lu et al., 2020; Müller, 2020; Park et al., 2020; van den Beukel and van der Voort, 2017; Ventsislavova et al., 2016) was collected without considering its potential relevance for taking over driving control. Afterwards they were classified into the following five categories: Information about the own vehicle and requi- red behavior, information about vehicles in the surrounding area, information about applicable traffic rules and road signs, information about navigation and information about the cause of the TOR. Within the categories, infor- mation was systematically assigned to the respective two scenarios, resulting in a total of 56 items for the “Roadworks” scenario and 62 items for the “Accident” scenario. Examples of information in each category are shown in Table 1.
Situational Awareness in the Context of Automated Driving 163
Table 1. Example information for the five categories modified for the applied scenarios.
An online survey (n = 78) was then conducted to assess the information collected in terms of its relevance for safe vehicle control takeover. In the process, the respective scenario was first described to the participants in a short text. Subsequently, questions on the understanding of the situation were asked in order to be able to sort out the data sets for which the questions were not answered correctly. Participants were then asked to rate the informa- tion collected within the categories for each scenario in terms of its relevance to the safe takeover of vehicle control and subsequent safe driving through the described scenario on a 6-point Likert scale from “very unimportant” to “very important”. The 6-point scale was chosen to avoid the tendency towards the middle and to prevent items from being classified as “neutral” (Moosbrugger and Kelava, 2020). To calculate the weighting factor, all outli- ers were first removed from the data set and finally the normalized mean value was formed and squared for the individual information. The informa- tion was then classified into three equidistant weighting categories, “high”, “medium” and “low” based on the calculated weighting factors.
Driving Simulator Study In order to test whether a weighted evaluation of the SAGAT questions com- pared to an unweighted evaluation leads to a more accurate quantification of
situational awareness and thus to a higher correlation with takeover perfor- mance after a TOR, a study (n = 32) was conducted in a fixed-base driving simulator with 360-degree visual simulation. After completing a question- naire on demographics, driving experience and knowledge about automated vehicles, the participants first completed a test manual drive to familiarize themselves with the driving simulator and the study procedure. They experi- enced the automated drive as well as the TOR, and the process of measuring situational awareness with the help of the SAGAT method was carried out as an exemplary procedure.
Afterwards they completed the two driving scenarios, during which the vehicle drove autonomously for approximately 10 minutes while they were reading on their mobile phone or tablet. This was followed by a multimodal TOR (Bazilinskyy and Winter, 2015), which provided both visual and audi- tory requests to resume the driving task. The head-up display also showed a countdown of the time remaining before the autonomous driving functions were switched off. Shortly before the countdown had run out, the simulation was paused unannounced to measure situational awareness using SAGAT (Endsley, 1988). The simulation then resumed and the test persons had to manually drive the vehicle through the situation while their take-over per- formance was recorded using the driving data. Since the interruption lasted less than 6 minutes, the takeover performance should not have been affe- cted (Endsley, 2000). Thereby the number of collisions, time to takeover, standard deviation and maximum of steering angle, standard deviation and maximum of acceleration as well as standard deviation and maximum of deceleration were used as parameters for the takeover performance (Mül- ler, 2020). To avoid sequence effects, the two scenarios, “Roadworks” and “Accident”, were interchanged. To control for simulator sickness, the Simu- lator Sickness Questionnaire according to Kennedy et al. (2009) was used both before and after the drives.
The selection of information requested by SAGAT was done following the methodology described by Endsley (1988). From the previously iden- tified information, a total of 21 questions were selected for each scenario, which on the one hand could be answered within a time budget of a maxi- mum of six minutes, and on the other hand were relevant to the scenario, but not necessarily predictable (Endsley, 1988). The questions were chosen to cover all three levels of situational awareness (Endsley, 2015). In order to test whether the previously calculated weighting has an influence on the determination of situational awareness, questions with a high, a medium as well as a low weighting factor were thereby included in alternating order.
RESULTS
Participants A total of 34 test persons took part in the study, while only 32 data sets could be evaluated due to simulator sickness and incorrect data recording. The prerequisite for participation was the possession of a class B driving license
Situational Awareness in the Context of Automated Driving 165
(European System) and experience on German motorways. The average age of the 25 male and 7 female participants was 34.8 years (min = 21 years, max = 65 years). 13 of the participants stated an annual driving performa- nce of up to 5,000 km, one participant rated the annual driving performance between 20,000 and 50,000 km and the remaining 18 were in between. 16 of the participants do not use any assistance systems while driving. Of the remaining test persons, 14 stated that they use cruise control on a regular basis. In the self-assessment of their knowledge of automated vehicles, 2 par- ticipants rated their knowledge as very good, 8 as good, 12 as average, 7 as low and 3 as very low.
Effect of Unweighted and Weighted Situational Awareness Total Score on Takeover Performance The comparison of the unweighted and weighted total score for situational awareness shows that for the “Roadworks” scenario a significant difference (significance level p = 0.05) between the unweighted total score (M = 45.8%, SD = 15.2%, n = 32) and the weighted total score (M = 55.8%, SD = 16.6%, n = 32) can be determined using a T-test (t(62) = −2.451, p = .017). The effect size according to Cohen (1992) is r = .30, corresponding to a medium effect. For the “Accident” scenario, however, the difference between the weighted and the unweighted score is not significant (t(62) = −1.351, p = .182).
The analysis of the correlation between situational awareness and take- over performance parameters using Bravais-Pearson correlation and simple linear regression shows no correlation for either the unweighted or weigh- ted total score. Correlations are found only within the takeover performance parameters. In the “Accident” scenario, the time to take action correlates with both the maximal acceleration (r = −.441, p = .012, n = 32) and the maximal deceleration (r = −.452, p = .009, n = 32), each with a moderate effect according to Cohen (1992). The maximal acceleration and the maxi- mal deceleration increase the faster the test persons intervene after the TOR. There is also a correlation between maximum acceleration and deceleration (r = .498, p = .004, n = 32) with a medium effect. Test persons who slowed down very sharply at the beginning of the intervention also accelerate very sharply after the intervention. In the “Roadworks” scenario, the time until intervention also correlates with both the maximum acceleration (r = −.353, p = .047, n = 32) and the maximum deceleration (r = −.501, p = .003, n = 32), acceleration with a moderate effect and deceleration with a strong effect. Again, the maximum acceleration and deceleration increase the faster the test persons intervene after the TOR. A correlation between these two cannot be found in the “Roadworks” scenario.
Effect of Particular Information on Takeover Performance Since the comparison of the total scores for situation awareness does not indicate whether individual information contribute more or less to good takeover performance, the answers to the individual questions were fur- ther analyzed. For each of the SAGAT questions, it was examined if the
characteristics of takeover performance show a significant difference depen- ding on whether the question was answered correctly and to what extent the correct answer to the question correlates with the takeover performance parameters.
For the “Accident” scenario, time to intervention correlates with whether test persons were aware of the speed limit (r = .434, p = .013, n = 32, medium effect size according to Cohen (1992)) and whether there was a vehicle next to them (r = −.399, p = .024, n = 32, medium effect size). In addition, both acceleration (r = −.354, p = .047, n = 32, medium effect size) and dece- leration (r = −.388, p = .028, n = 32, medium effect size) correlate with the knowledge of the speed limit. The test persons who were aware of the speed limit also showed a late takeover of vehicle control (t(30) = −2.130, p = .041, r = .36, medium effect size). Those who were aware of the prese- nce of a vehicle next to them showed an earlier takeover of vehicle control (t(30) = 2.387, p = .024, r = .40, medium effect size). The knowledge of the speed limit is further associated with a tendency to accelerate or decelerate less.
For the “Roadworks” scenario, time to intervention correlates with whe- ther test persons knew which of the lanes were affected (r = .431, p = .014, n = 32, medium effect size), whether a lane change was required (r = .451, p = .010, n = 32, medium effect size), and whether there was a vehicle behind them (r = −.373, p = .035, n = 32, medium effect size according to Cohen (1992)). While knowledge of the lanes affected by the roadworks (t(30) = −2.768, p = .010, r = .45, medium effect size) and knowledge of the necessity to change lanes (t(30) = −2.620, p = .014, r = .43, medium effect size) are related to a late takeover of vehicle control, knowledge of the presence of a vehicle behind the own vehicle correlates with an early takeover of vehicle control after the TOR (t(30) = 2.205, p = .035, r = .39, medium effect size).
Correct Answers Per Weighting Category For further analysis of the data, the number of correctly answered questions within the high, medium, and low Weighting Categories is compared using single-factor Analysis of Variance.
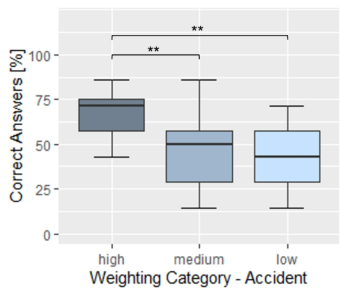
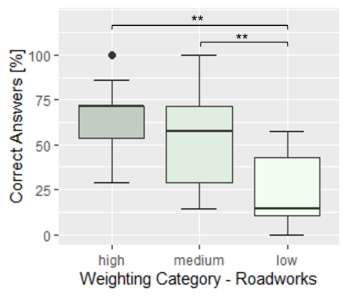
For the “Accident” scenario, Figure 1 shows that questions in the “high” Weighting Category were most frequently answered correctly (Md = 71%, SD = 14%), followed by the “medium” (Md = 50%, SD = 23%) and “low” (Md = 43%, SD = 18%) categories. Post-hoc tests with Bonferroni corre- ction indicate a significant difference between the “high” and “medium” as well as the “high”and “low”categories. Also, for the “Roadworks”scenario, Figure 2 shows that the questions in the “high”weighting category were most frequently answered correctly (mean = 71%, SD = 20%), followed by the “medium” (mean = 71%, SD = 22%) and “low” (mean = 14%, SD = 20%) categories. The post-hoc tests with Bonferroni correction, indicate a signifi- cant difference between the categories “high”and “low”as well as “medium” and “low”.
Situational Awareness in the Context of Automated Driving 167
Figure 1: Correct answers per Weighting Category for the “Accident” scenario (*signi- ficance level <0.05, **significance level <0.01).Figure 2: Correct answers per Weighting Category for the “Roadworks” scenario (*significance level <0.05, **significance level <0.01).
Correct Answers Per Information Category In order to further analyze the allocation of the test persons’ attention, the data were analyzed by means of a factorial analysis of variance to determine whether the test persons answered the questions of one of the information categories presented in the table more often correctly than those of the other information categories.
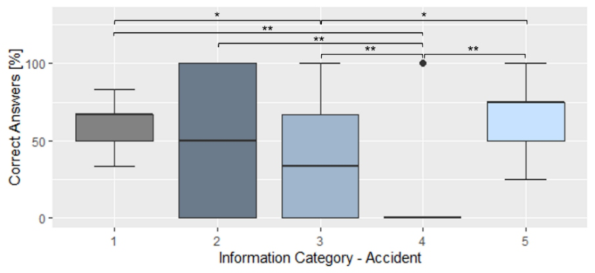
For the “Accident” scenario, Figure 3 shows that the questions from cate- gory 4 “Information about navigation” were answered incorrectly by most test persons (Md = 0%, SD = 29%).
Post-hoc tests with Bonferroni correction show a significant difference to all four other categories. The most frequently correctly answered que- stions were those in category 5 “Information about the cause of the TOR” (Md = 75%, SD = 23%), followed by questions in category 1 “Information about own vehicle and required behavior” (Md = 67%, SD = 14%), cate- gory 2 “Information about vehicles in the surrounding area” (Md = 50%, SD = 39%) and category 3 “Information about traffic rules and road signs”
Figure 3: Correct answers per Information Category for the “Accident” scenario (*signi- ficance level <0.05, **significance level <0.01. Categories: 1 - Information about the own vehicle and required behavior, 2 - Information about vehicles in the surrounding area, 3 - Information about applicable traffic rules and road signs, 4 - Information about navigation, 5 - Information about the cause of the TOR).
(Md = 33%, SD = 32%). However, there is a significant difference only between category 3 and category 1 and between category 3 and category 5.
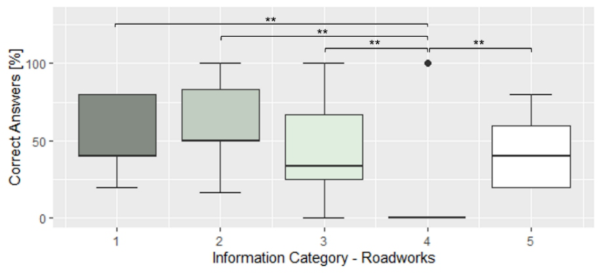
For the “Roadworks” scenario, Figure 4 shows that the questions from category 4 “Information about navigation” were also answered incorrectly by most test persons (Md = 0%, SD = 17%).
Again, post-hoc tests with Bonferroni correction show a significant diffe- rence to all four other categories. In this case, the most frequently correctly answered questions were those from category 2 “Information about vehicles in the surrounding area” (Md = 50%, SD = 22%), followed by questions from category 1 “Information about own vehicle and required behavior” (Md = 40%, SD = 22%), category 5 “Information about the reason for the
Figure 4: Correct answers per Information Category for the “Roadworks” scenario (*significance level <0.05, **significance level <0.01. Categories: 1 - Information about the own vehicle and required behavior, 2 - Information about vehicles in the surroun- ding area,3 - Information about applicable traffic rules and road signs, 4 - Information about navigation, 5 - Information about the cause of the TOR).
Situational Awareness in the Context of Automated Driving 169
TOR” (Md = 40%, SD = 23%), and category 3 “Information about traffic rules and road signs” (Md = 33%, SD = 31%).
DISCUSSION
The analysis of the data shows that due to the lack of correlation between the situation awareness total scores and the characteristics of the takeover performance, no conclusion can be made regarding whether a weighted or an unweighted evaluation of the SAGAT is better suited to capture situation awareness sufficiently accurately. The reason for the lack of correlation could be on the one hand, that a good takeover performance is not necessarily related to a good situation awareness (Kokar and Endsley, 2012) and that the study should be conducted with more test persons, which would understate the fortunate results. In addition, it is possible that the scenarios were too easy to set up and therefore the takeover was not difficult, so that situational awareness had little effect on takeover performance. Another reason could be that the measures of takeover performance are not appropriate and that a more suitable, differentiated evaluation concept needs to be used to quantify takeover performance, such as the TOC-rating from Naujoks et al. (2018). Accordingly, the suitability of the weighting of the SAGAT questions should be further investigated in future studies.
Considering only the takeover behavior, the correlation between early takeover and high maximum deceleration and acceleration suggests that individuals who intervene quickly also react with an extreme response, i.e. extreme deceleration. As a result, they also accelerate extremely to com- pensate their reaction and adapt to the traffic. People who take more time to take over therefore react with a behavior that is better adjusted to the situation.
The finding from the evaluation of the effect of individual information on takeover performance that persons who knew which lanes were affected by the roadworks and that they did not have to change lanes took longer to take control of the vehicle could be due to the fact that they knew that they did not have to perform any complicated maneuvers and therefore allowed the car to continue driving on its own. The reason for the correlation between late takeover of control and knowledge of the applicable speed limit could be that persons who took control later used this time to orient themselves and thus were able to absorb more information than those who took control earlier. However, this should be verified in future studies by interviewing them about their reactions and thoughts during the procedure as well as by eye movement analysis.
The result of the evaluation of the correct answers per weighting cate- gory suggests that after a TOR, the test persons first direct their attention to the information rated as most important, before focusing on the aspects of the environment rated as moderately important, and then eventually paying attention to the aspects rated as unimportant. Thereby it is noteworthy that in the “Roadworks” scenario the moderately important questions were answ- ered correctly more often than in the “Accident” scenario, which could be due to the fact that roadworks are more familiar situations than an accident
and can therefore be comprehended more quickly, thus freeing up capacity to consider other aspects. However, this would have to be verified by eye movement analysis in future studies.
The evaluation of the correct answers per information category also shows that in both scenarios less attention was paid to the information on naviga- tion as well as to the applicable traffic rules. While in the “Accident”scenario attention was mainly focused on the cause of the TOR, in the “Roadworks” scenario this was only in third place. In both scenarios, information about one’s own vehicle and one’s own behavior was still in second place. Informa- tion about vehicles in the environment was ranked third in the “Accident” scenario, while it was given the most attention in the “Roadworks” scenario. Again, it can be assumed that roadworks are more familiar situations and do not require as much attention as an accident to decide on further action. Ano- ther reason for the focus on the accident might be that it presents a greater hazard than a roadwork zone, due to debris or people running around. The reason why the vehicles in the surrounding area have a different importance in both of the scenarios could be that there was more traffic in the “Roadw- orks” scenario and therefore more attention was needed to detect all other vehicles.
CONCLUSION
The results of this work describe a suitable procedure to identify relevant SAGAT questions for a TOR due to roadworks or an accident on the moto- rway. However, in order to conclude whether a weighted or unweighted evaluation of the SAGAT questions is better suited to capture situational awareness in the context of automated driving, the results of the takeover performance need to be evaluated with more sophisticated methods. Never- theless, the results show that the higher weighted information is consistent with the aspects on which the drivers initially focus their attention after the TOR. In the “Accident”scenario, this is mainly the reason for the TOR, while in the “Roadworks”scenario, the vehicles in the surrounding area first attract attention. The reason for this could be the more familiar and less dangerous situation of the roadworks. However, the reasons behind the drivers’ choice of attentional allocation strategy should be investigated in further studies using eye-tracking as well as a post-takeover interview.
REFERENCES
Bazilinskyy, P. & Winter, J. de (2015). Auditory interfaces in automated driving: an international survey. PeerJ Computer Science, 1, e13. https://doi.org/10.7717/pe erj-cs.13 Cohen, J. (1992). A power primer.: Cohen, J. (1992). A power primer. Psychological
Bulletin, 122(1), 155–159, Psychological bulletin, 112 (1), pp. 155–159. Crundall, D. (2016) Hazard prediction discriminates between novice and experienced drivers, Accident Analysis & Prevention, vol. 86, pp. 47–58 [Online]. DOI: 10.1016/j.aap.2015.10.006.
Situational Awareness in the Context of Automated Driving 171
Endsley, M. (1988) Situation Awareness Global Assessment Technique (SAGAT), Proceedings of the IEEE 1988 National Aerospace and Electronics Conference (S. 789–795). Endsley, M. (2015) Situation Awareness Misconceptions and Misunderstandings,
JOURNAL OF COGNITIVE ENGINEERING AND DECISION MAKING, vol. 9, no. 1, pp. 4–32. Endsley, M. R. (2000) Direct measurement of Situation Awareness: Validity and use of SAGAT, Situation Awareness Analysis and Measurement. Kennedy, R. S., Lane, N. E., Berbaum, K. S. and Lilienthal, M. G. (2009) Simu-
lator Sickness Questionnaire: An Enhanced Method for Quantifying Simula- tor Sickness, The International Journal of Aviation Psychology, vol. 3, no. 3, pp. 203–220. Kokar, M. M. and Endsley, M. R. (2012) Situation Awareness and Cognitive Modeling, IEEE Computer Society. Kurpiers, C., Biebl, B., Mejia Hernandez, J. and Raisch, F. (2020) Mode Awa-
reness and Automated Driving—What Is It and How Can It Be Measured?, INFORMATION, vol. 11, no. 5, p. 277. Lu, Z., Coster, X. and de Winter, J. C. F. (2017) How much time do drivers need to obtain situation awareness? A laboratory-based study of automated driving, Applied Ergonomics, vol. 60, pp. 293–304. Lu, Z., Happee, R. and de Winter, J. C. F. (2020) Take over! A video-clip study
measuring attention, situation awareness, and decision-making in the face of an impending hazard, Transportation Research Part F: Traffic Psychology and Behaviour, vol. 72, pp. 211–225 [Online]. DOI: 10.1016/j.trf.2020.05.013. Merat, N., Jamson, A. H., Lai, F. C., Daly, M. and Carsten, O. M. (2014) Transition to manual: Driver behaviour when resuming control from a highly automated veh- icle, Transportation Research Part F: Traffic Psychology and Behaviour, vol. 27, pp. 274–282. Moosbrugger, H. and Kelava, A. (2020) Testtheorie und Fragebogenkonstruktion Bd.
2, Springer, Berlin, Heidelberg. Müller, A. L. (2020) Auswirkungen von naturalistischen fahrfremden Tätigkeiten während hochautomatisierter Fahrt, Dissertation, Darmstadt, TU Darmstadt. Naujoks, F., Wiedemann, K., Schömig, N., Jarosch, O. and Gold, C. (2018) Expert-
based controllability assessment of control transitions from automated to manual driving, MethodsX, vol. 5, pp. 579–592. Park, D., Yoon, W. C. and Lee, U. (2020) Cognitive States Matter: Design Guidelines for Driving Situation Awareness in Smart Vehicles, Sensors (Basel, Switzerland), vol. 20, no. 10. SAE (2021) J3016-2021: Taxonomy and Definitions for Terms Related to Driving
Automation Systems for On-Road Motor Vehicles. van den Beukel, A. P. and van der Voort, M. C. (2017) How to assess driver’s interaction with partially automated driving systems - a framework for early concept assessment [Online], Applied Ergonomics, vol. 59. Ventsislavova, P., Gugliotta, A., Peña-Suarez, E., Garcia-Fernandez, P., Eisman, E.,
Crundall, D. and Castro, C. (2016) What happens when drivers face hazards on the road?, Accident; analysis and prevention, vol. 91, pp. 43–54. Zhou, F., Yang, X. J. and de Winter, J. C. F. (2022) Using Eye-Tracking Data to Predict Situation Awareness in Real Time During Takeover Transitions in Con- ditionally Automated Driving, IEEE Transactions on Intelligent Transportation Systems, vol. 23, no. 3, pp. 2284–2295.
LISTED IN THE AHFE DIGITAL BOOKSTORE CATALOGUE
Explore the complete digital volume
Human Factors in Transportation
Read this individual research paper free through the original publisher, or explore the full digital proceedings book.
ISBN 978-1-958651-71-1
Explore this ISBN in the AHFE Bookstore ↗Listed in the July 2026 bookstore catalogue; search by ISBN to confirm current availability · Digital book purchase optional