Takahiro Miki, Yusuke Osawa, Keiichi Watanuki (2024). Design of 3D point cloud dataset of indoor spaces for feature extraction using Autoencoder with PointNet. In: Affective and Pleasurable Design. AHFE Open Access, vol. 123, pp. 18–28. https://doi.org/10.54941/ahfe1004672
In this study, a novel method was developed to automatically construct a virtual space with a high degree of freedom of expression. The constructed virtual space was designed to reflect the spatial shape of the real space and the arrangement of objects. First, the global shape of the interior space was used to design a dataset for extracting the spatial features of the real space by three-dimensional (3D) scanning of the real space and using a PointNet-based autoencoder. The dataset consisted of the point cloud data of a rectangular 3D object that was a simple imitation of a room in real space and focused on two items, namely the number of input points and the number of data points. The results of the autoencoder restoration indicate that spatial feature extraction can be performed when the number of data is 5000 or more.
Extended reality (XR) technologies, such as virtual reality (VR) and mixed reality (MR), have attracted considerable attention. However, their use in arbitrary locations is hindered by the surrounding environment and the limited range of motions (Ishizaka et al., 2018). Because MR has fewer restrictions on the range of operation, MR is used in specific situations in which virtual objects or digital information are superimposed onto a real space. Additionally, virtual space creation involves many processes, render- ing generalization difficult. Therefore, the development of technology that can automatically construct a virtual space with a high degree of freedom of expression, such as tilting or expanding the space while allowing the user to see the surrounding environment, is critical.
Generally, three-dimensional (3D) objects are used to represent virtual spaces, such as mesh data consisting of points and surfaces. With 3D mea- surement devices such as LiDAR becoming increasingly popular, 3D point cloud processing technology has attracted attention for use in mesh data creation. Because the automatic generation of 3D objects using 3D point
Design of 3D Point Cloud Dataset of Indoor Spaces for Feature Extraction 19
clouds is a critical topic of research, generative models, such as latent- space generative adversarial networks (l-GAN) (Achlioptas et al., 2018), have been devised. Many of these models have been evaluated using open-source datasets consisting of large CAD models across specific object categories, such as ModelNet (Wu et al., 2015). Therefore, a method for generating point clouds using datasets consistent with individual intentions is yet to be established. The datasets are mostly object categories, such as chairs and cars, and deep learning is yet to be used in entire indoor or outdoor spaces as a dataset to generate point clouds.
Therefore, to automatically construct a virtual space with a high degree of freedom of expression that reflects the spatial shape of the real space and the arrangement of objects, this study focused on the global shape of the indoor space and designed a dataset for extracting the spatial features of the real space using a 3D point cloud deep learning method through 3D scanning of the real space. This study designed a dataset for extracting the spatial features of the real space using a deep learning method for 3D point clouds. The dataset was created by focusing on two items, namely number of input points and amount of data. Feature extraction was performed using indoor spatial point cloud data, and spatial feature extraction was evaluated by comparing the shapes of the input point cloud and restored output point cloud as well as the distance error.
DATASET DESIGN FOR THE EVALUATION OF SPATIAL FEATURE EXTRACTION For feature extraction corresponding to an arbitrary interior space, in this study, first a rectangular 3D object that imitated a room in real space was converted into point cloud data to extract global features, such as the walls of the interior space, These data were used as a dataset.
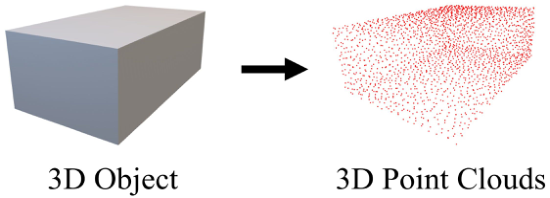
Design of 3D Point Cloud Data From 3D Object First, Unity game engine was used to create 100 rectangular 3D objects of 2.5 to 28 m in width x, 2.2 to 4.0 m in height y, and 5 to 28 m in depth z. Next, the Poisson disk sampling method (Yuksel, 2015) was used to convert the created 3D objects into point-cloud data. In this method, the minimum distance between two sampled points can be controlled such that it does not fall below a specified value. Thus, all points in the sampled cloud were separated by a certain distance to perform sampling with high spatial uniformity (see Figure 1).
Conditions for Dataset Design In this study, the dataset conditions were determined by focusing on two parameters, namely the number of input points and the number of data points. We used 1024 and 2048 as the number of input points because using these number of points in a point-cloud classification problem using PointNet yields high accuracy (Charles et al., 2017). To evaluate a wide range of data, the number of data points was set to 100, 500, 1000, 5000, and 10,000. These data points were created by randomly rotating the 100-point cloud
Figure 1: Conversion from a three-dimensional (3D) object to 3D point clouds.
data around the y-axis and expanding the data. Therefore, a dataset with two input points × five data conditions = 10 conditions was created (Table 1). During training, the dataset was normalized to a range of 0–1 based on the maximum and minimum lengths of the rectangular point-cloud data in the dataset. The dataset was divided into 90% training data and 10% test data.
CREATING A POINTNET-BASED AUTOENCODER Creating an Autoencoder
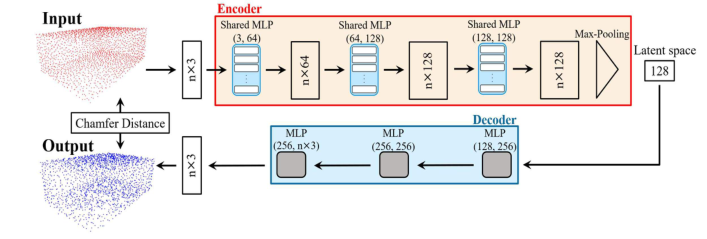
An autoencoder is an algorithm in which a neural network is used to com- press (encode) an input point cloud to a lower dimension, extract feature vectors in the latent space, and extract features from the feature vectors to restore (decode) an output point cloud similar to the shape of the input point cloud. This mechanism is used for image denoising, anomaly detection, clus- tering, and data generation. In this study, to perform feature extraction using a 3D point cloud, the PointNet network structure was used as the encoder to extract feature vectors.
PointNet
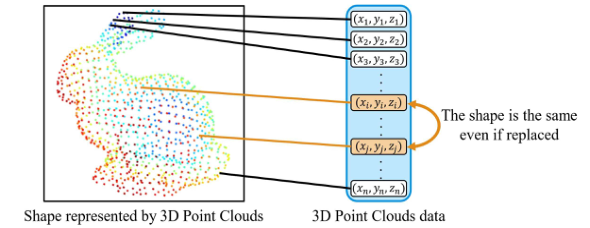
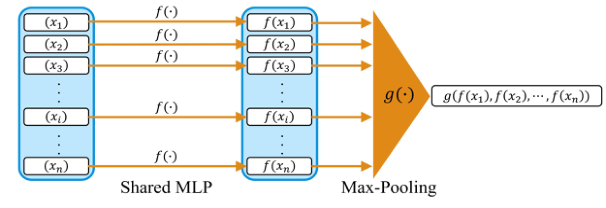
PointNet is a point-cloud deep-learning method in which point-cloud data are used as direct input data. The 3D point clouds do not have an order or grid structure for any of the data elements. Figure 2 reveals this phenomenon, which reveals that even if any two points in the 3D point cloud are swapped, the entire 3D point cloud has the same shape. Such data are called out-of- order data and are difficult to handle in deep learning. PointNet supports such unordered data by introducing symmetric functions, in which the out- puts do not change even if the order of the input data changes. PointNet pro- posed a network that combines shared MLP and max pooling. In shared MLP, the same MLP is applied to each point along the channel direction. Let f(p, θ) (where p is a 3D point and θ is a weight parameter of MLP) be a shared MLP; for example, when 3D point cloud data (p1, p2, · · · , pi, · · · , pj, · · · pn) are input, the output is (f
, f
, · · · , f
, · · · , f
, · · · , f
pn
pi
pj
p1
p2
). In PointNet, max pooling is used to aggregate the features from all points. This pooling operation is applied channel by channel to the entire point-cloud. Using the maximum value as the pooling function, the maximum value of the entire point cloud remains unchanged, even if the order of the points changes; thus, the output is independent of the order of the points. As described, the
Design of 3D Point Cloud Dataset of Indoor Spaces for Feature Extraction 21
combination of a shared MLP and max pooling produces the same output, regardless of the point order, and the desired symmetric function can be described using a neural network. Figure 3 illustrates the structure of this network.
Table 1. Conditions for the dataset design.
Table available in the original PDF paper.
Number of input points Number of data
1024 100 500 1000 5000 10000 2048
Machine Learning Model Structure The PointNet-based autoencoder proposed by Achlioptas et al was used to set the structure and hyperparameters of the machine learning model. Specifi- cally, the encoder consists of three shared MLP with batch normalization and an activation function (the ReLU function), which is applied after each layer. Convolution is performed on the coordinates and features of each input point using a common weight across all input points. Next, max pooling is used to aggregate the global features of the point cloud to obtain a 128-dimensional feature vector in the latent space. The decoder consisted of three fully coupled layers, except for the output layer, where the ReLU function was applied. The Chamfer Distance was used as the loss function for model training along with the Adam optimization method. The batch size was 32, the learning rate was 0.0005, and 200 epochs were trained.
Figure 2: Unordered 3D point clouds.Figure 3: Symmetric function of PointNet.Figure 4: Structure of the machine learning model for the autoencoder.
EVALUATION OF SPATIAL FEATURE EXTRACTION Machine Learning Model Structure
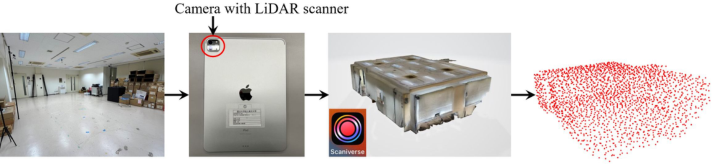
Indoor space point cloud data in the real space were used as the evaluation data. The input point cloud to the autoencoder and the output point cloud after restoration were visualized, and the shapes were compared. If shapes were restored precisely, the distance error was compared as a quantitative evaluation. An Apple iPad Pro (2nd generation) equipped with a direct time- of-flight (dToF) LiDAR system and Scaniverse, a 3D scanning application was used to acquire indoor spatial point cloud data. The dToF is a LiDAR ranging method that is used to measure the distance to an object by detecting the time difference between the light emitted from the light source and the light reflected from the object until it reaches the sensor. The acquired point cloud data were output as 3D objects using Scaniverse and sampled using the Poisson disk sampling method for input conditions of 1024 and 2048 points. Figure 5 displays the flow from the acquisition of the indoor space point-cloud data to sampling. The interior was approximately 7.5 m wide, 2.8 m high, and 11 m deep. The point cloud data were normalized to the range 0–1 based on the maximum and minimum lengths of the rectangular point cloud data in the dataset and subsequently input to a trained autoencoder for restoration. Nor- malization parameters were used to denormalize the restored output point cloud.
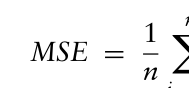
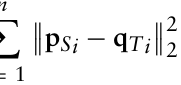
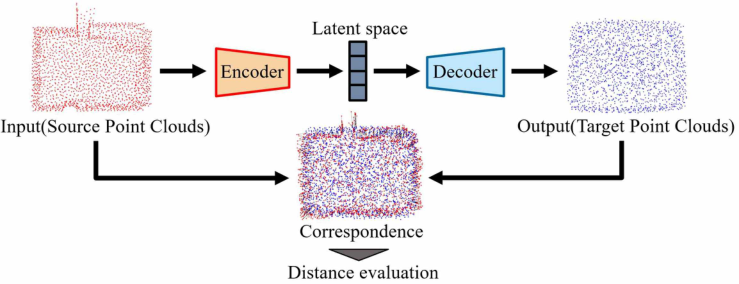
The input and restored output point cloud were visualized, their shapes were compared, and the distance error was compared as a quantitative eval- uation of whether the points were restored precisely. The input point cloud of the autoencoder is the source point cloud S, and the output point cloud after restoration is the target point cloud T. Mapping was performed using the kd- tree method, which is the nearest-neighbor search method. Next, the distance between the points was calculated using the mean squared error (MSE)[m2] as follows:
n X
Equation reproduced from the original PDF.
2 [m2] (1)
Equation reproduced from the original PDF.
Design of 3D Point Cloud Dataset of Indoor Spaces for Feature Extraction 23
Figure 5: Flow from acquisition to sampling of indoor spatial point cloud data.Figure 6: Flowchart of evaluation methods.
Here, pSi denotes the i-th coordinate vector of the source point group, qTi denotes the i-th coordinate vector of the target point group, and n denotes the overall number of points. Figure 6 displays the sequence of the evaluation methods.
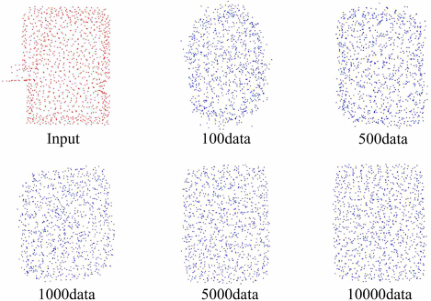
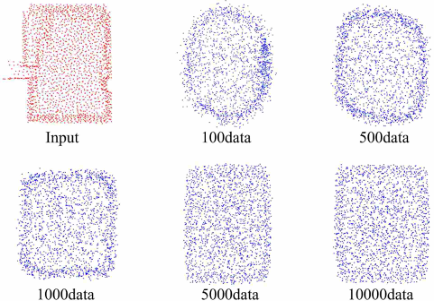
Evaluation Results Figures 7 and 8 display the visualization results of the restoration for each number of data points when the number of input points was 1024 and 2048, respectively. All visualized point clouds were obtained from the y-axis direc- tion. The shape did not differ considerably when the number of data was 5000 or more for either condition, whereas scattering of points and round- ing near the vertices were observed when the number of data was 1000 or less. However, the scattering of points was larger and the rounding near the vertex was larger for 2048 points than for 1024 points. More than 5000 points could be recovered without scattering or rounding near the vertices. Next, for each input point number condition, the MSE was calculated by mapping the input and output point groups when the number of data were 5000 and 10,000. Tables 2 (a) and (b) present the results. With respect to the number of input points, the MSE decreased and the accuracy increased with the increase in the number of points. For the number of data points, the MSE decreased and became more accurate with the increase in the number of data points.
Figure 7: Visualization of restoration results when the number of input points is 1024.Figure 8: Visualization of restoration results when the number of input points is 2048.Table 2. Results of mean squared error (MSE) evaluation. (a) Number of input points: 1024 (b) Number of input points: 2048
Table available in the original PDF paper.
Number of data MSE[m2] Number of data MSE[m2]
5000 0.141 5000 0.121 10000 0.136 10000 0.109
DISCUSSION
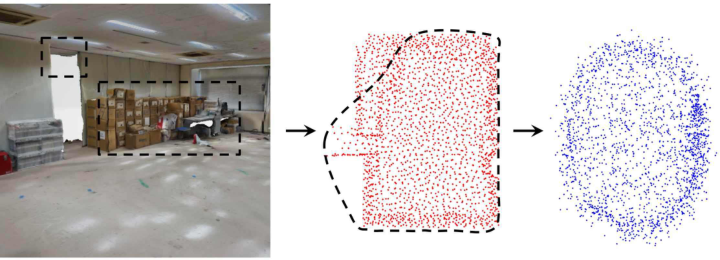
Discussion of Visualization and MSE Results The visualization results revealed that the scattering of points and rounding near the vertices when the number of data points was less than 1000 for both conditions. This phenomenon could be attributed to feature points for determining the shape of objects tending to gather around edges, corners, and vertices of point cloud data in the classification problem. In the indoor space used in this study, obstacles were present near the vertices of the room, which prevented LiDAR from accurately acquiring the area near the vertices of the room. Additionally, a point cloud of the passage outside the room
Design of 3D Point Cloud Dataset of Indoor Spaces for Feature Extraction 25
Figure 9: Feature extraction near vertex by autoencoder (2048points, 100data).
was acquired. Therefore, as displayed in Figure 9, the learned autoencoder recognized the area near the top of the room as the top of the obstacle and recognized the passage as the top, resulting in an rounded shaped output. Furthermore, point scattering and roundness were greater for the 2048 input points than for the 1024 input points. This phenomenon could be attributed to obstacles and pathways recognized and restored as vertices. Thus, the more points are in these spaces, the greater is the number of features in these spaces. Therefore, the autoencoder judged that the 2048 points were a group of input points with rounded features and outputted a more rounded shape. A total of 5,000 data points were used. In terms of the number of data, the shape can be recovered without scattering of points when the number of data is 5000 or more. This phenomenon could be attributed the autoencoder easily extracting the features of the rectangular point cloud in the dataset when the amount of data is large. Therefore, the shape near the vertices is corrected and output as a shape closer to the rectangular point cloud.
The distance error results revealed that the MSE was smaller, and the accuracy increased with the increase in the number of input points. This phenomenon suggests that the more input points are, the easier it is to extract important features and the more accurate the restoration are. Fur- thermore, the MSE decreased, and the accuracy increased as the number of data points increased because, as mentioned, the autoencoder could extract more features of the rectangular point cloud shape from the dataset when the number of data increased, resulting in an output of a shape closer to the rectangular point cloud with correction near the vertices. However, because difference was not notable, when a rectangular point cloud is used as the dataset, the autoencoder is speculated to extract fewer features because of the absence of objects such as furniture. Therefore, MSE accuracy did not differ considerably when the number of data were 5000 or more.
Therefore, when the dataset is a rectangular point cloud, the restoration of the indoor space point cloud data can extract the spatial features of the shape if the number of data is 5000 or more. Using a rectangular point cloud as the dataset, the autoencoder can restore the point cloud by complement- ing the unevenness of the interior space. This strategy can effectively remove noise and complement missing data when LiDAR acquires point-cloud data
in real space. However, completely restoring the shape of the interior space is not possible because of the following two factors: first, because the dataset is a rectangular point cloud, it cannot completely restore the shape of a room that is not in the dataset. To solve this, room space dataset, such as ScanNet (Dai et al., 2017), should be used. ScanNet is used for the deep learning of 3D point clouds for object recognition and segmentation. Second, the autoencoder used in this study introduced the symmetric function of Point- Net, which could be attributed to its configuration to represent the features of the entire point cloud as a single vector. Thus, the symmetric function was suitable for extracting global features of the entire interior space but not for extracting local features such as the shape of objects or fine irregularities. To solve this problem, numerous methods have been established for extracting local features by convolution and using neural networks that perform image processing. If information can be extracted on the 3D shape of an indoor space by focusing on the local shape around each point, then PointNet can be used for autoencoding. If information can be extracted by focusing on the local shape around each point, then the shape of the input point cloud can be restored with higher accuracy than an auto-encoder using PointNet.
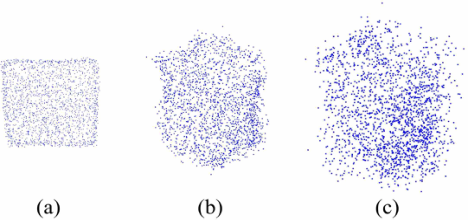
Applicable Limitations In this study, we input indoor space point cloud data with sizes within the range of the rectangular point cloud in the dataset (created with a width x of 2.5 to 20 m, a height y of 2.2 to 4.0 m, and a depth z of 5 to 28 m) to the autoencoder and performed restoration. However, because larger indoor spaces than in the above range exist in real space, we verified the output of the autoencoder when a rectangular point cloud larger than the dataset was input to the autoencoder to confirm the limits of the application. Specifically, we created rectangular point cloud data for the three conditions in Table 3. In condition (a), we added +1.0 m for width, +0.1 m for height, and +1.0 m for depth till the maximum value of the dataset. In condition (b), we added ×1.5 m width, ×1.5 m height, and ×1.5 m depth from the maximum value of the dataset. In condition (c), the width, height, and depth were added by ×2.0 m, ×2.0 m, and ×2.0 m, respectively, from the maximum value of the dataset. Under all conditions, the number of input points was standardized to 2048, and the data were input to a trained autoencoder with 10000 data points.
Table 3. Conditions for verifying applicability limits.
Figure 10 displays the visualization results for the output point cloud. Under condition (a), the output points were slightly rounded near the ver- tices, but points were not scattered. For conditions (b) and (c), the points
Design of 3D Point Cloud Dataset of Indoor Spaces for Feature Extraction 27
Figure 10: Visualization of output point clouds according to each condition.
were scattered, and the output point cloud had a shape that differed consid- erably from that of the input rectangular point cloud. Therefore, using point cloud data within the size range of the point cloud data in the dataset is nec- essary as the input point cloud when performing spatial feature extraction using a 3D point cloud.
CONCLUSION
In this study, a novel method was devised to automatically construct a virtual space with a high degree of freedom of expression. The virtual reflects the spatial shape of the real space and the arrangement of objects. In this method, first, the global shape of the interior space was considered to design a dataset for extracting spatial features of the real space by scanning the real space in 3D and using a PointNet-based autoencoder. The dataset consisted of the point cloud data of a rectangular 3D object that was a simple imitation of a room in real space, focusing on two items, namely the number of input points and the number of data points. The results of the autoencoder restoration revealed that spatial feature extraction can be achieved when the number of data points is 5000 or more, regardless of the number of input points. In the future, we will develop machine learning models for spatial feature extraction and extraction of local features, such as object shape and fine irregularities, by using the indoor space dataset used in the deep learning of 3D point clouds for segmentation.
REFERENCES
Achlioptas, P., Diamanti, O., Mitliagkas, I., and Guibas, L. (2018) “Learning Representations and Generative Models for 3D Point Clouds”, proceedings of the 35th International Conference on Machine Learning, pp. 40–49. Charles R. Qi, Hao Su, Kaichun Mo, and Guibas, L. J. (2017) “PointNet: Deep
Learning on Point Sets for 3D Classification and Segmentation”, proceedings of the IEEE Conference on Computer Vision and Pattern Recognition, pp. 652–660. Dai, A., Chang, A. X., Savva, M., Halber, M., Funkhouser, T., and Nießner, M. (2017) “Scannet: Richly-annotated 3D Reconstructions of Indoor Scenes,” Proceedings of the IEEE Conference on Computer Vision and Pattern Recognition, pp. 5828–5839.
Ishizaka, N., Osawa, Y., Watanuki, K., Kaede, K., and Muramatu, K. (2018) “Measurement of Braking and Driving Forces during Walking on Virtual Slope”, proceedings of the Design and Systems Conference, p. 1206. Wu, Z., Song, S., Khosla, A., Yu, F., Zhang, L., Tang, X., and Xiao, J. (2015) “3d
shapenets : A deep representation for volumetric shapes”, proceedings of the IEEE Conference on Computer Vision and Pattern Recognition, pp. 1912–1920 . Yuksel, C. (2015) “Sample Elimination for Generating Poisson Disk Sample Sets” Computer Graphics Forum, Volume 34, No. 2, pp. 25–32.
LISTED IN THE AHFE DIGITAL BOOKSTORE CATALOGUE
Explore the complete digital volume
Affective and Pleasurable Design
Read this individual research paper free through the original publisher, or explore the full digital proceedings book.
ISBN 978-1-958651-99-5
Explore this ISBN in the AHFE Bookstore ↗Listed in the July 2026 bookstore catalogue; search by ISBN to confirm current availability · Digital book purchase optional