Naoki Nozawa, Yusuke Osawa, Keiichi Watanuki (2024). Feature Selection and Estimation of Route and Gait During Walking with Route and Speed Changes by Surface Electromyograph Using Transformer. In: Affective and Pleasurable Design. AHFE Open Access, vol. 123, pp. 73–81. https://doi.org/10.54941/ahfe1004678
Recently, with the increase in the number of elderly people requiring nursing care, walking assist devices using an inverted pendulum model and electrical stimulation have been researched and developed to improve the walking ability of elderly people. However, most of these assistive devices are designed only for straight walking on a flat road and do not support unsteady walking, such as turning and acceleration/deceleration. It has been reported that unsteady walking accounts for 40% of our daily life. Hence, it is important to provide training and support for unsteady walking. The purpose of this study is to develop a walking training and support system for gait that includes unsteady walking. Therefore, we built a model that predicts the gait and route of the next walking cycle by extracting muscle movements from surface electromyography (sEMG) data using machine learning. We used transformer for machine learning because of its powerful expressive capabilities and its success in various fields, such as natural language processing, computer vision, and speech processing. Transformer can also evaluate sEMG features in learning by visualizing attention. sEMG and joint angles were recorded while walking along the walking routes set up in this study, and these data were divided into data sets for each cycle to predict the next walking motion, which were then used for training. sEMG was recorded using a wireless electromyograph and the joint angles were recorded using optical motion capture. A Butterworth bandpass filter was applied to the recorded sEMG to remove noise in the range of 20–450 Hz. Then, sEMG at the maximum voluntary contraction was normalized to the reference. The recorded joint angle data were normalized with respect to the range of motion of the joint. The training model utilizes the encoder block of transformer, which consists of a multi-head attention and feed forward network. The multi-head attention can extract different expressions by setting up multiple attentions in parallel. The learning parameters were Adam for the optimization algorithm, a learning rate of 0.001, a batch size of 1, and the number of epochs was set to the value that optimizes the loss, with the maximum value set to be 200. Therefore, the mean absolute error of the joint angles was 2.04°, which was sufficient to estimate the gait in the next cycle. The visualization of attention confirmed the extraction of different representations, indicating that the learning process was successful.
In recent years, researchers have developed various gait support and train- ing devices to improve the walking ability of the elderly. However, most of these devices are designed for straight walking on flat surfaces and do not support unsteady walking such as turning, acceleration/deceleration, and ascending/descending stairs. Unsteady walking accounts for 40% of daily walking (Brain et al., 2007), highlighting the need for the development of gait support and training devices that can support unsteady walking. To sup- port unsteady movements, the system must predict the user’s condition and provide support based on the predicted values. This study investigated the possibility of predicting speed changes during wayfinding walking using sur- face electromyography (sEMG). Wayfinding walking is a common activity in which individuals walk in search of a destination in a given area. It involves various unsteady elements such as turning and acceleration/deceleration. To make predictions, a machine learning model has been developed that uses a Transformer structure that has proven successful in fields such as natural language processing and computer vision.
Muscle Activity and Gait Acquisition Experiments During Walking As part of the study, experiments were conducted to measure muscle activity and gait during walking.
Equipment Used and Test Muscles A wireless electromyograph, motion capture system, and destination indica- tion system were used for the experiment. The wireless electromyograph had a sampling frequency of 1,000 Hz. Ten electromyographs were attached on each side of the five test muscles that exhibited significant myoelectric paths during turning.
Tensor Fasciae Lates (TFL)
Vastus Medialis Oblique (VMO)
Medial Hamstrings (MH)
Medial Head of Gastrocnemius (MHG)
Tibialis Anterior (TA) The muscles were positioned as follows: for the TFL, on the muscle belly of the two transverse fingers anteriorly inferior to the superior anterior iliac spine; for the VMO, on the muscle belly of the two transverse fingers proximal to the bottom of the patella and inclined inwards at an angle of approximately 55
to the long femoral axis. The MH electrode was placed on the muscle belly approximately 15 cm proximal to the patellar cleft, the MHG electrode was placed on the muscle belly five transverse fingers distal to the knee socket skin line. The TA electrode was placed on the muscle belly on the medial side of the tibial ridge distal to the four transverse fingers from the tibial rough surface. The electrodes were placed on the left and right legs in a targeted manner.
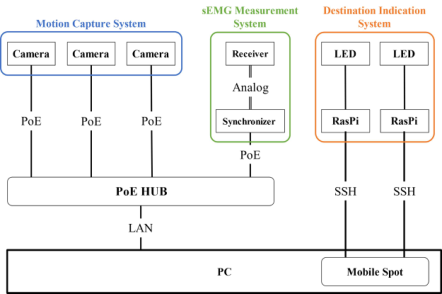
The destination is indicated along the subject’s walking route via LEDs as part of the destination indication system. The LEDs were controlled by a Raspberry Pi and remotely controlled via SSH communication a. During the exploratory walk, participants randomly selected illuminated LEDs as their destinations. All devices were connected to a single PC and time-synchronized, as shown in Figure 1.
Figure 1: Communication system for experimental devices.
Feature Selection and Estimation of Route and Gait During Walking 75
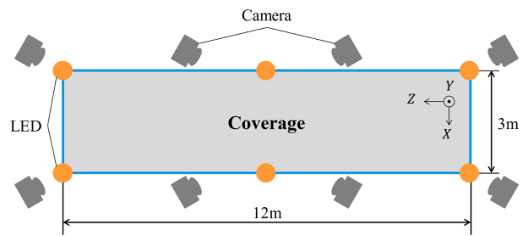
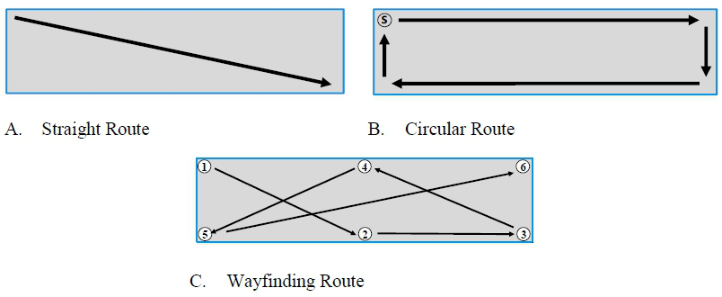
Experimental Environment and Walking Route The experiment was conducted in an indoor room that was at least 3 m high, 5 m wide, and 20 m deep, and was free of furniture. Eight cameras were positioned to cover an area 3 m high and 12 m wide, as shown in Figure 2. Six LEDs were placed around the shooting area as landmarks for exploratory walking. Three walking paths were created for the experiment: straight ahead along the diagonal line of the shooting range, as shown in Figure 3a; clock- wise and counterclockwise around the walking path, as shown in Figure 3b; and in the direction of the LEDs illuminated by the destination indication system, as shown in Figure 3c.
Experimental Procedure The experiment was conducted with a male participant (22 years old) with the approval of the Human Ethics Committee of Saitama University. Elec- tromyographs and markers were attached to the participant’s test muscles before they were asked to wear a motion-capture suit. The participant com- pleted the walking task in 27 trials, performing three trials at three different speeds (subjective normal speed, subjective high speed, and subjective slow speed) on both straight and circular routes. The participant then completed five trials of the walking task using the destination indication system on the wayfinding route.
Data Processing for the Construction of Velocity Prediction Models The following process was applied to the sEMG and motion-capture data acquired during the experiment.
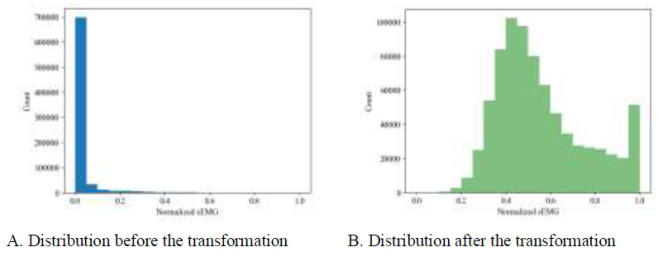
Noise Reduction and Normalization of sEMG To remove power supply and body motion noise in the sEMG, a Butter- worth bandpass filter with passing frequencies in the range of 20–450 Hz was applied based on the work of De Luca et al. The data distribution was then smoothed using the root mean square of the moving average (MoveRMS) expressed in equation (1) and adjusted using the Box-Cox transform from equation (2) (see Figure 4).
Equations and mathematical formulas are available in the original paper PDF.
j
Lambda (λ) was calculated using maximum likelihood estimation. The value of λ that maximizes the log-likelihood function L(λ) expressed in equation (3) was used. Normalization was then performed using the maximum (xmax) and minimum values (xmin), as expressed in equation (4), to ensure that the data fell between 0 and 1.
[Equation or mathematical symbol available in the original paper PDF]
[Equation or mathematical symbol available in the original paper PDF] P x(λ) i
i −x(λ)2
X
−N
log (xi)
2 log
N
Equations and mathematical formulas are available in the original paper PDF.
i
Figure 4: Changes in sEMG data distribution due to Box-Cox transformation.
Calculation and Normalization of the Straight-Line Directional Velocity The data obtained from the motion capture contained missing values owing to shielding and other factors; therefore, a second-order spline interpolation
Feature Selection and Estimation of Route and Gait During Walking 77
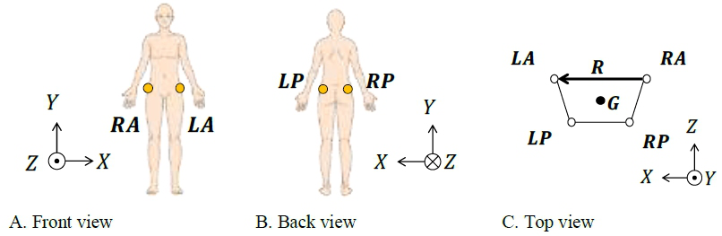
was performed. The center of gravity G in the absolute coordinate system XYZ was then determined using the coordinates of the four markers RA, LA, RP and LP attached to the waist, as shown in Figure 5, with reference to the origin of the captured area. The reference vector R was determined as described in equation (5).
Rx, Ry, Rz
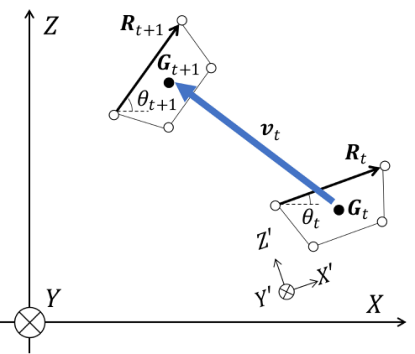
The experiment was conducted on a floor without undulations. There- fore, it was assumed that there was no change in the height direction, and the velocity change in the XZ plane was analyzed. The reference vector and the center of gravity at time t were labelled as Rt and Gt, respectively. The relative coordinate system X
′Z
′ was used, with the X
′ axis parallel to Rt The velocity vt was determined by taking the time derivative of the center of grav- ity coordinates, Gt + 1−Gt. Equation (6) shows how it can be converted into a relative coordinate system using the rotation matrix R (−θ).
cos θt sin θt −sin θt cos θt
The Z
′ component of the velocity v
′ t expressed in the relative coordinate sys- tem is defined as the Straight-Line Directional Velocity. Similar to the sEMG, the velocity was normalized using the maximum and minimum values to ensure that the data ranged between zero and one.
Figure 5: Marker mounting position and coordinates.
Creating Datasets With Lag Features Let X = {X1, X2, . . . , Xn | Xi ∈R10} be the processed sEMG time series and Y = {Y1, Y2, . . . , Yn | Yi ∈R1} be the Straight-Line Directional Velocity time series, where Xt and Yt represent the states at time t. If lag features are used to predict the next l datasets from the past k datasets, the datasets can be expressed as shown in equations (7) and (8):
n
X(k)
Xt−k, Xt−k + 1, . . . , Xt−1 | Xi ∈R10o
Y(l)
Yt, Yt + 1, . . . , Yt + l−1 | Yi ∈R1o
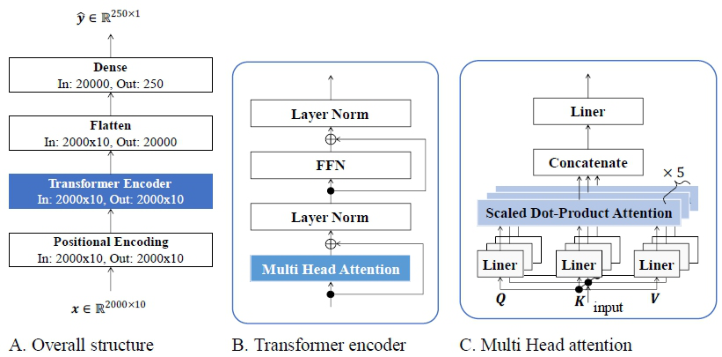
Building a Model to Predict Straight-Line Directional Velocity A prediction model with a Transformer encoder (Vaswani et al., 2017), as shown in Figure 7a, was created to predict the straight-line directional velocity from the previous sEMGs. The model consists of four layers of Transformer encoders, each of which contains a Multi Head attention and a feedforward network (FFN), with residual learning applied through a skip connection (Figure 7b).
Multi Head attention and five attention mechanisms were arranged in par- allel to extract different representations (Figure 7c). In this architecture, self- attention can capture the relationship between different parts of each input, and attention is computed using equation (9), whereas FFN uses GELU, rep- resented by equation (10), as the activation function to achieve non-linear transformation and random regularization (Hendrycks and Gimpel, 2016), where 8 represents the standard normal distribution function.
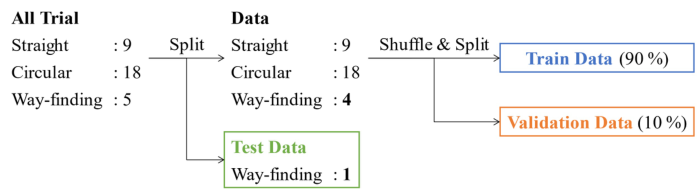
During training, one trial of the five wayfinding walks was used as test data to evaluate the performance of the model, while 90 % of the remain- ing data were used for training the model, and 10 % were used to validate overfitting (Figure 8). The datasets for each of the five wayfinding walking trials were designated as Fold 1 to Fold 5, and the model was evaluated by cross-validation. The relevant parameters for training were the mean abso- lute error (MAE) as the loss function, Adam as the optimization algorithm, a learning rate of 0.001, a batch size of 16, and 50 epochs.
Figure 6: Straight-line directional velocity at time t.
!
W0x + b0
+ b1 (11)
Feature Selection and Estimation of Route and Gait During Walking 79
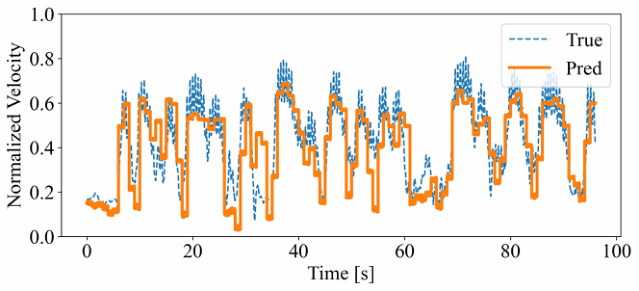
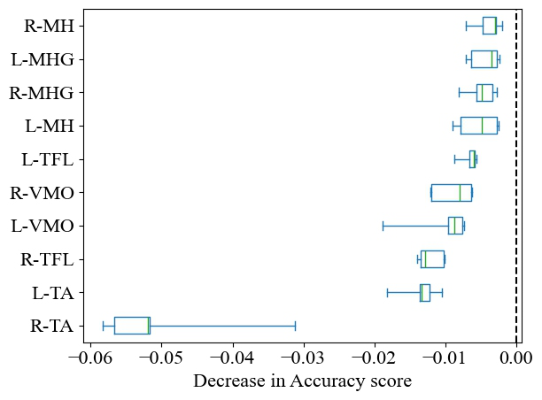
Table 1 lists the evaluation indices for each Fold. Figure 9 shows the true and predicted values for Fold 5. Although the trend of the time series was well cap- tured, some output values differed from the true values. Figure 10 illustrates the permutation feature importance (PFI), which indicates the importance of the features.
Figure 9: True and predicted values of the test data in fold 5.Figure 10: PFI score for the training data.
CONSIDERATION The PFI score showed that the MH and MHG were significant features. Therefore, training was conducted using only the MH and MHG sEMGs as input. The results are listed in Table 2. Although the accuracy decreased, some predictions were possible. Walking speed can be predicted from sEMG of the MH and MHG muscles alone. The MH is a muscle group that performs extension of the knee joint and extension and adduction of the hip joint, and it is hypothesized that prediction of these movements from the sEMG predicts the straight-line directional velocity during walking.
It is hypothesized that the larger error observed when only some sEMGs are used as input is related to the swaying motion during walking. During human gait, the body sways from side to side to maintain balance, and this swaying cannot be predicted by MH and MHG alone. To reduce the error, it is considered effective to remove the noise caused by swaying from the
Feature Selection and Estimation of Route and Gait During Walking 81
straight-line velocity or select muscles to predict swaying and use them for training.
CONCLUSION
The aim of this study was to develop a system to support and train non- stationary walking and to investigate whether it is possible to predict straight- line directional velocity using the sEMG. The distribution of the sEMG data was adjusted using a Box-Cox transformation, and the straight-line velocity was calculated using a rotation matrix. With this data, a dataset was created, and a machine learning model was trained. The results showed that changes in velocity during the exploration walk were adequately captured. The results also suggest that the sEMG of the medial hamstrings and medial head of the gastrocnemius may be able to predict velocity changes.
Table 2. Prediction results using only the MH and MHG sEMGs for each epoch.
Brain, G. C., Greta, B. C, Glenn, K. K., and Micheal, S. O. (2007). “Video task analysis of turning during activities of daily living”, Gait & Posture, Volume 25 No. 2, pp. 289–294. https://doi.org/10.1016/j.gaitpost.2006.04.003 De Luca, C. J., Gilmore, L. D., Kuznetsov, M., and Roy, S. H. (2010). “Filtering
the surface EMG signal: Movement artifact and baseline noise contamination”, J Biomech, Volume 43 No. 8, pp. 1573–1579. https://doi.org/10.1016/j.jbiomech .2010.01.027 Hendrycks, D., and Gimpel. K. (2016). “Gaussian Error Linear Units (GELUs)”, [online]. [Preprint]. [Viewed 13 August 2024]. Available from: https://arxiv.org/ abs/1606.08415 Vaswani, A., Shazeer, N., Parmar, N., Uszkoreit, J., Jones, L., Gomez, N. A.,
Kaiser, L., and Polosukhin, I. (2017). “Attention is All You Need”, Adv Neural Inf Process Syst, Volume 30.
LISTED IN THE AHFE DIGITAL BOOKSTORE CATALOGUE
Explore the complete digital volume
Affective and Pleasurable Design
Read this individual research paper free through the original publisher, or explore the full digital proceedings book.
ISBN 978-1-958651-99-5
Explore this ISBN in the AHFE Bookstore ↗Listed in the July 2026 bookstore catalogue; search by ISBN to confirm current availability · Digital book purchase optional