Akinari Hirao, Akari Yoshida (2024). Vibration sensitivity measurement of back and buttocks for effective seat vibration warning. In: Advances in Human Factors of Transportation. AHFE Open Access, vol. 148, pp. 642–652. https://doi.org/10.54941/ahfe1005256
The study focuses on tactile sense as an additional modality for presenting information to drivers, alongside the visual displays and auditory sounds commonly used for driver assistance functions.Although many haptic warnings with built-in vibrators in the steering wheel and seats have been studied, there are few practical applications for seats, despite the steering wheel already being implemented. Vibration-based information presentation is an effective means of presenting information as it can present information solely to the driver without causing anxiety to passengers through display or sound warnings.Furthermore, as autonomous driving functions become more widespread, drivers can focus on other activities while in a hands-off state during Level 3 or higher levels. The presentation of information through tactile sense is considered highly effective when using a seat that maintains constant contact with a large area of the occupant during other activities.Many vibration warnings use eccentric motors to create vibrations, which limits the range of vibration characteristics that can be achieved. Additionally, there is insufficient knowledge regarding the optimal vibration characteristics and areas for stimulus. This study measured the vibration sensitivity of the back and buttocks in contact with the seat and investigated the vibration characteristics required for efficient warnings.Vibro-transducers were attached to the clothed human back surface of the body, and the minimum vibration output required to elicit a response was recorded for each frequency (30 to 150 Hz, in 10 Hz increments) at various sites on the back and buttocks. The resulting data was used to create a vibration sensitivity map of the back side of the body.First, in a preliminary experiment, 39 points on the back of the body from the 7th cervical vertebra to the back of the knee were comprehensively measured at 80 mm intervals for seven participants (4 males and 3 females), and the measurement points were narrowed down by examining regional differences, left-right differences, and individual differences. Finally, 22 measurement points were selected based on the skeleton and vibration sensitivity was measured. The buttocks, which have different pelvic positions inside the body, were measured in the supine and sitting positions.In the experiment, measurements were taken on a total of 14 subjects, 7 male and 7 female adults, and a vibration sensitivity map of the backside of the body was created.Based on the sensitivity maps, the effectiveness of the warning stimulus will be tested using a seat vibration warning with driving simulator.
With the development of various driver assistance functions and sensors, the amount of information presented to the driver from the vehicle while driving is on the increase. Much of this information is presented using visual dis- plays and auditory sounds. In this study, we focused on the sense of touch as another modality that can be used during driving. Many haptic warnings with built-in transducers in the steering wheel or seat have been studied, and Lane Departure Waring (LDW), which uses steering wheel vibration to pro- vide vibration simulating rumble strips, has also been implemented in many vehicles (Nakamura et al., 2017). However, there are few practical examples of vibration information presentation in seats. Vibration-based information provision is an effective means of presenting information because it can only
Vibration Sensitivity Measurement of Back and Buttocks 643
be presented to the driver and does not cause passenger anxiety through display or sound alarms.
The recent spread of automatic driving functions has made it possible for drivers to focus their attention on other activities other than driving in the hands-off state in Level 3 and above automatic driving. Therefore, the presen- tation of information by tactile sensation using a seat that is always in contact with the occupant over a large area during other activities is considered to be very effective. Furthermore, drivers who are released from their driving duties may experience a decrease in alertness. In order to ensure a smooth takeover of driving when a vehicle makes a Take Over Request (TOR) when switching from automatic to manual operation in response to the external environment, a Driver Monitoring System using an infrared camera or simi- lar device monitors the driver’s state and alerts the driver if it detects a decline in alertness. Driver Drowsiness Alert Warning (DDAW) is also mandatory. In other words, it can be said that warning technology is becoming necessary to ensure that driving is taken over from the vehicle to the driver.
In this study, it was considered that, in order to reliably transmit infor- mation even when the driver’s level of alertness is reduced, an efficient seat vibration warnings can be given by stimulating the parts of the seat that are in constant contact with the occupants and that are highly sensitive area to vibration stimulation.
Several studies have been conducted on the presentation of tactile infor- mation using seats, and their effectiveness has been verified in various appli- cations, such as Lane Departure Waring (LDW) and Curve Speed Warning (CSW) etc. In addition to the presence or absence of warnings, the presenta- tion of information in the direction of turn by turn in hazards or navigation, and the presentation of information by epiphany movement of the vibrating parts have also been studied.
However, as these vibration warnings mainly use eccentric motors, the vibration characteristics obtained by the motor are fixed, and most studies focus on the vibration characteristics, mainly the time density and amplitude of the vibration stimulus from multiple transducers built into a specific part of the seat (Sayer et al., 2005), (Finch, 2008), (Hogema et al., 2009), (Chang et al., 2011), (Dass et al., 2013), (Schwalk et al., 2015). As a result, there is insufficient knowledge on the optimum vibration stimulus characteristics and vibration points of body part for warnings.
On the other hand, the structure and characteristics of the four types of tactile receptors in the Pachinian Corpuscles, Meissner Corpuscles, Merkel’s Disks and Ruffini cylinder have been clarified in studies on vibration per- ception. However, most studies have focused on tactile perception at the fingertips or palms, and the density of the sensory organs has been clarified, but the state of distribution throughout the body, especially on the backside in contact with the seat, is not clear, and only rough regional differences in vibra- tion sensory thresholds throughout the body as well as regional differences in the two-point discrimination zone have been clarified.
The aim of this study was to measure the vibration sensitivity of the back and buttocks in contact with the seat, and to determine the vibration characteristics for efficient warning.
644 Hirao and Yoshida
METHODS
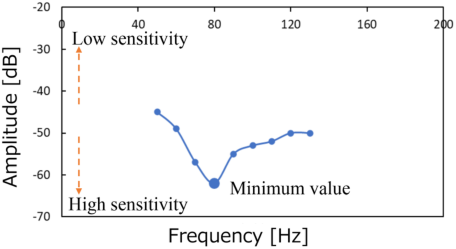
Definition of Vibration Sensitivity Vibration sensitivity is the threshold value of the vibration stimulus that can be perceived through the mechanoreceptors in response to a vibration stimu- lus to the skin. In this study, the amplitude threshold for each frequency of the vibration stimulus was determined, and the minimum value of the threshold curve was defined as the higher sensitivity, and the minimum frequency and amplitude were determined (see Figure 1).
Figure 1: Definition of vibration sensitivity.
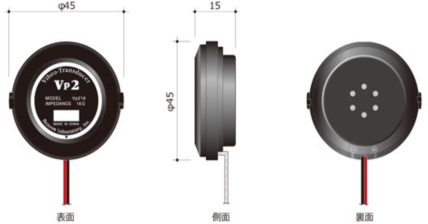
Measurement Methods A vibro-transducer (Acouve Lab. Vp.210) shown in Figure 2 was attached to the backside of the body in a clothed state, and the minimum vibration output at which vibration was perceived was declared for each frequency when the input frequency of the vibration stimulus (30 to 150 Hz, in 10 Hz increments) was changed at each site on the back and buttocks. The frequency-perceived minimum amplitude characteristics shown in Figure 1 were obtained. By measuring this at each site on the back surface of the body, a vibration sensitivity map of the body is created.
Figure 2: Vibro-transducer.
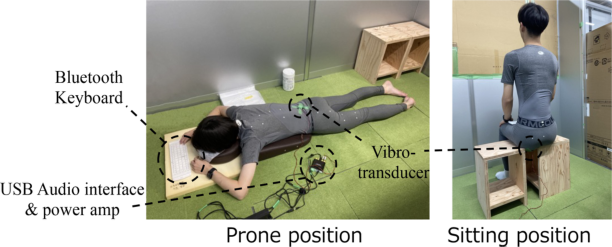
The measurement was carried out using elastic sportswear that adheres to the skin but does not deform the body surface due to pressure (see Figure 3).
Vibration Sensitivity Measurement of Back and Buttocks 645
The measurements were carried out in the supine position and in the sitting position seated straight on a flat chair.
Figure 3: Sensitivity measurement.
The amplitude of the vibration stimulus was self-adjusted by individual participants using a Bluetooth keyboard, starting from the high amplitude when the frequency was fixed and using the adjustment method, and the participants were asked to report the minimum value at which they could ‘perceive the vibration’. The measurement time per frequency condition was approximately 20 seconds.
For the input waveform, Sin Wave, Square Wave, Sawtooth Wave and Triangular Wave were compared at the same frequency and amplitude, and Sin Wave was selected because it causes no discomfort and is less affected by operating noise.
Vibrations were generated and played back using the test tone function of the music editing software (Ableton Live 11), amplified by a power amp (Fosi Audio Hi-Fi Wireless Amplifier ZK1002D) with built-in USB Audio Interface and input to the vibro-transducer.
The vibration amplitude values [dB] shown in this paper are the output values of the music editing software and not the actual vibration accelera- tion output via the power amp. In this paper, the amplitude values can also be converted into sensitivity to the input acceleration to the body by con- verting the amplitude values into actual acceleration, although this has no influence since the sensitivity level, such as high or low, is the subject of this paper.
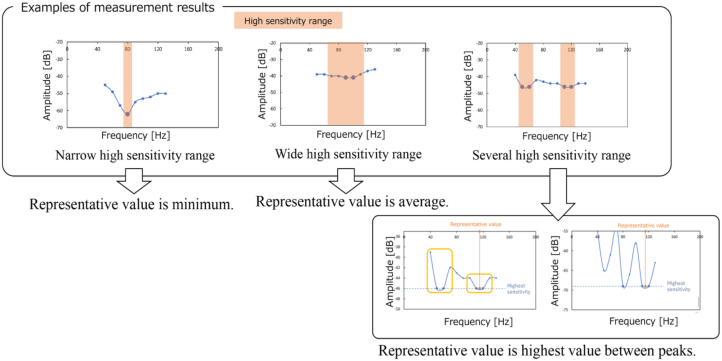
Determination of Vibration Sensitivity The measured frequency-sensitivity characteristics do not necessarily result in a distribution with a single high-sensitivity peak value, but may have a wide high-sensitivity range or multiple peak values, depending on the measurement point and the participants; therefore, representative values were extracted from the threshold curve and subjected to analysis (see Figure 4).
646 Hirao and Yoshida
Figure 4: Determination of vibration sensitivity value.
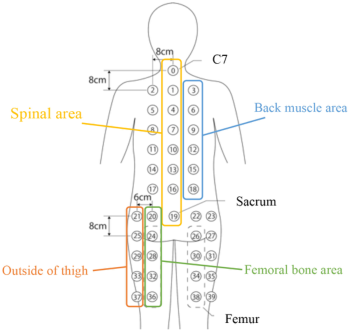
Measurement Points of Back and Buttock As a preliminary experiment, seven healthy adult participants in their 20s (Male 4, Female 3, Height: 169±9.2 [cm], Weight: 57.7±8.1 [kg]) were mea- sured at intervals of 80 mm, which is approximately 2 vibro-transducers of 45 mm diameter. Vibration sensitivity was measured at 40 points on the backside of the body from the 7th cervical vertebra to the back of the knee (see Figure 5), and the measurement points were narrowed down by examining regional differences, left-right differences and daily differences (reproducibility).
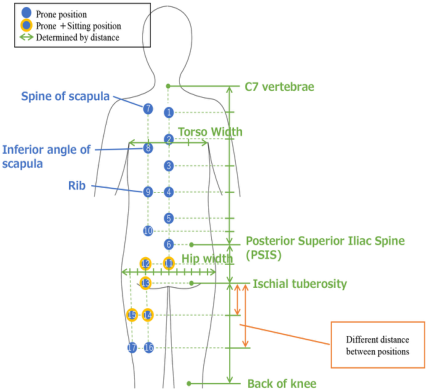
Based on the results of the preliminary experiments, the 22 measurement sites shown in Figure 6 were finally selected based on the skeletal position of each participant to measure the vibration sensitivity, excluding the sites that could be regarded as having equivalent sensitivity.
Figure 5: Sensitivity measurement points for preliminary experiments.
Vibration Sensitivity Measurement of Back and Buttocks 647
Figure 6: Sensitivity measurement points.
Perticipants Fourteen adults in their 20s (Male 7, Female 7, Height: 168±7.1 [cm], Weight: 56.1±7.5 [kg]) were measured with informed consent to create a vibration sensory sensitivity map of the back of the human body.
RESULTS
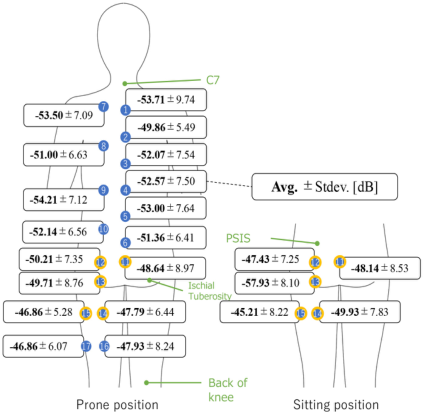
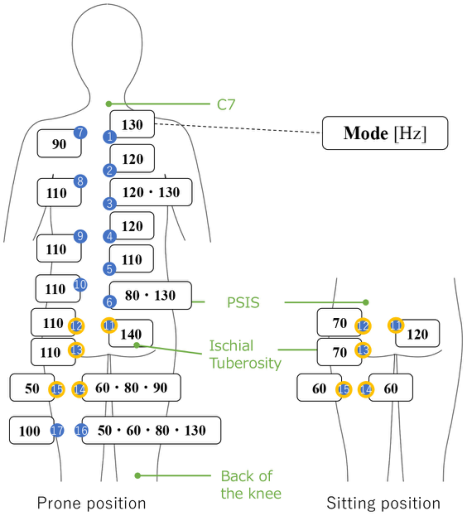
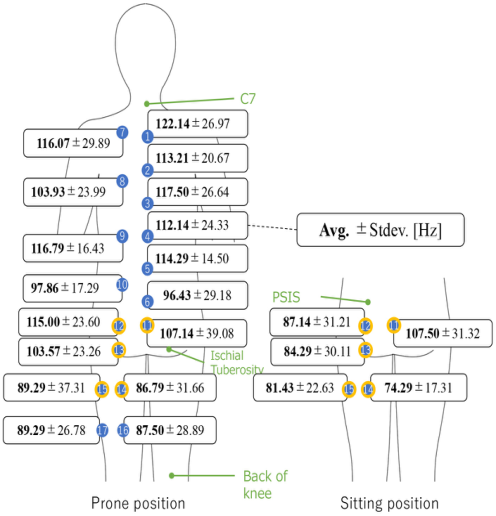
Vibration sensitivity maps created from the representative vibration sensitivity values obtained in the experiments are shown in Figures 7 to 9.
Figure 7: Body map of average vibration amplitude sensitivity.
648 Hirao and Yoshida
Figure 8: Body map of average vibration frequency sensitivity.Figure 9: Body map of mode vibration frequency sensitivity.
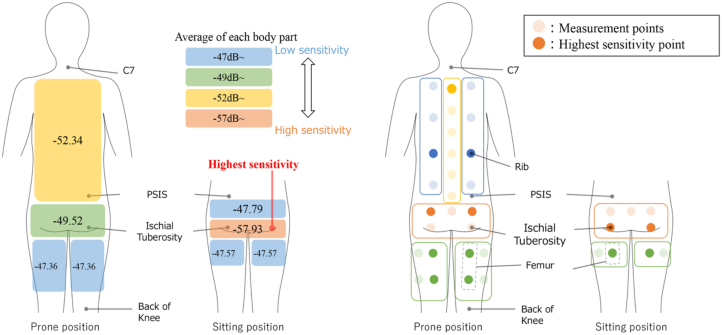
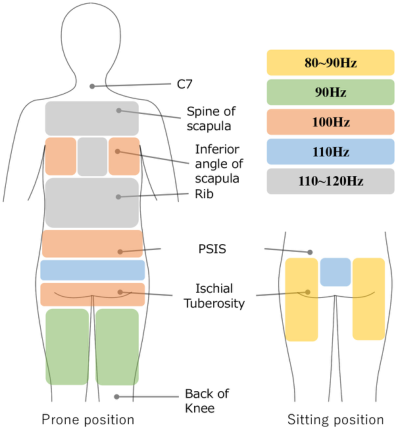
Based on the above results, maps organising the sites at the same level are shown in Figures 10 and 11.
Vibration Sensitivity Measurement of Back and Buttocks 649
Figure 10: Body map of minimum vibration amplitude sensitivity and highest sensitivity measurement point.Figure 11: Body map of high vibration frequency sensitivity.
DISCUSSION
Validity of Measurement Methods In previous studies, in combination with the role of sensory organs, 100–300 Hz is known to be sensitive in the Pachinian Corpuscles. However, the body dorsal high-sensitivity frequencies obtained in the present study were less than 100 Hz.
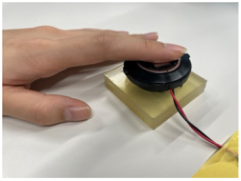
Therefore, using the measurement methods of this study, fingertip vibra- tion sensitivity was measured in 6 healthy adults in their 20s (Male 3, Female 3, Height: 172.0±6.5 [cm], Weight: 59.8±7.4 [kg]) with their fin- gertip of left index finger placed on the vibro-transducer (see Figure 12). The following data were obtained.
650 Hirao and Yoshida
Figure 12: Fingertip vibration sensitivity measurement.Figure 13: Vibration frequency sensitivity of fingertip.
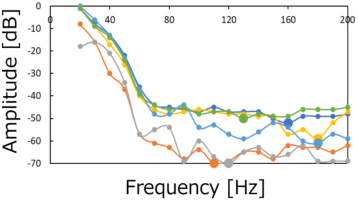
As shown in Figure 13, the vibration sensitivity of the fingertips was found to be high at 80 Hz and above, confirming a trend consistent with the litera- ture, thus confirming that the present method is appropriate as a method for measuring vibration sensory sensitivity.
General Discussion
Figure 10 shows that the amplitude threshold became smaller from the back closer to the thighs, and the frequency sensitivity became lower as shown in Figure 11. This trend is also consistent with the two-point discrimination thresholds (Myles et al., 2007) and vibration sensitivity of the back and thighs (Boff and Lincoln, 1988).
On the other hand, the distribution of sensitivity in thigh and buttock com- pression by the authors (Hirao et al., 2022) shows that it is less sensitive in the buttocks and becomes more sensitive closer to the knee, which does not correspond to vibration sensitivity. Unlike the sensation of pressure, in the case of vibration sensation, the vibration input to the sciatic bone was trans- mitted to the entire pelvis and acted on more sensory organs through bone conduction than was perceived by the sensory organs in the thighs.
The highest sensitivity was found at the position of the ischial tuberosity in the sitting posture, with a frequency mode of 70 Hz. This means that the most efficient vibration stimulus perceived is a vibration stimulus at 70 Hz just below the pelvis. However, when a vibratory element such as a voice coil, as used in this study, is mounted as the vibratory source of the vibration warning in the seat, discomfort object sensation due to the vibratory device is expected to occur around the pelvis, where the load is concentrated when seated, and this may worsen sitting comfort, making it difficult to achieve
Vibration Sensitivity Measurement of Back and Buttocks 651
a good balance with comfort. Therefore, it is considered that the next most feasible vibration alarm site is the upper backside of the pelvis around the posterior superior iliac spine, where the sensitivity is high.
The vibration sensitivity distribution obtained in this study will also pro- vide useful knowledge for the interpretation of vibration sensation and discomfort for vibration inputs such as ride comfort and local component resonance.
LIMITATIONS The measurements in this study were made with university students as exper- imental participants, so the data are limited in age range and do not include sufficient physical individual differences, such as those with high body mass index or muscularity.
The sensitivity of the system was measured under static conditions, so changes in sensitivity under dynamic vibration conditions have not been verified. During automatic driving, when arousal vibration stimulation is effective, the road surface vibration input is relatively stable, such as on high- ways, but it will be necessary to verify the effects of vibration under excitation conditions in the future.
CONCLUSION
In this study, the vibration sensitivity on the backside of the body was mea- sured and a sensitivity map was created. Based on the sensitivity body map, guidelines for efficient presentation of vibration information in the seat were obtained.
In the future, we plan to use a driving simulator based on the sensitivity body map to perform an alarm using a seat vibration stimulus during a driv- ing task or when arousal level decreases, and to verify the effectiveness of the warning. In addition, we plan to ensure a wide diversity of participants in the experiment to create a more generalised map, and to examine factors such as individual differences in sensitivity.
REFERENCES
Boff, K. R., & Lincoln, J. E. (Eds.). (1988). Engineering Data Compendium: Human Perception and Performance (Vol. II). Wright-Patterson Air Force Base, Ohio: Harry G. Armstrong Aerospace Medical Research Laboratory. Chang, W., Hwang, W., Ji, Y. G. (2011). Haptic Seat Interfaces for Driver Information
and Warning Systems, International Journal of Human- Computer Interaction, 27(12), pp. 1119–1132. Dass Jr., D. E., Uyttendaele, A., Terken. J. (2013). Haptic In-seat Feedback for Lane Departure Warning, Proceedings of the 5th International Conference on Automo- tive User Interfaces and Interactive Vehicular Applications (AutomotiveUI, 13), pp. 258–261. Finch, G., (2008) Driver Comprehension of Integrated Collision Avoidance System
Alerts Presented through a Haptic Driver Seat, PhD Thesis, Virginia Polytechnic and State University.
652 Hirao and Yoshida
Hirao, A., Naito, S., Yamazaki, N. (2022) Pressure sensitivity of buttock and thigh as a key factor for understanding of sitting comfort, Applied Sciences, 12(15), 7363, pp. 1–14. Hogema, J. H., De Vries, S. C., Van Erp, J. B. F., Kiefer, R. J. (2009). A Tactile Seat for
Direction Coding in Car Driving: Field Evaluation, IEEE Transactions on Haotics, 2(4), pp. 181–188. Nakamura, M., Nakashima, H., Hirao, A., Miki, Y. (2017) Development of Information Display Using Steering Vibration for Warning Function, JSAE Transactions, 48(2), pp. 445–450 (In Japanese). Myles, K., Binseel, M. S. (2007) The Tactile Modality: A Review of Tactile Sensitivity
and Human Tactile Interfaces, Army Research Laboratory, ARL-TR-4115. Sayer, T. B., Sayer, J. R., Devonshire, J. M. H. (2005) Assesment of a Driver Interface for Lateral Drift and Curve Speed Warning Systems: Mixed Results for Auditory and Haptic Warnings, Proceedings of the Third International Driving Sympo- sium on Human Factors in Driver Assessment, Training and Vehicle Design, pp. 218–224. Schwalk, M., Kalogerakis, N., Maier, T. (2015). Driver support by a vibrotactile
seat matrix - Recognition, adequacy and workload of tactile patterns in take-over scenarios during automated driving, Procedia Manufacturing, 3, pp. 2466–2473.
LISTED IN THE AHFE DIGITAL BOOKSTORE CATALOGUE
Explore the complete digital volume
Advances in Human Factors of Transportation
Read this individual research paper free through the original publisher, or explore the full digital proceedings book.
ISBN 978-1-964867-24-3
Explore this ISBN in the AHFE Bookstore ↗Listed in the July 2026 bookstore catalogue; search by ISBN to confirm current availability · Digital book purchase optional