Ting Chun Lung, Meng-Cong Zheng, Li-Jen Wang (2024). The Impact of Enhanced Information Presentation in Sports Event Broadcasting on Viewer Experience - A Case Study of Penalty Shootout in Football. In: Human Factors and Systems Interaction. AHFE Open Access, vol. 154, pp. 301–309. https://doi.org/10.54941/ahfe1005378
The widespread adoption of online media allows sports events worldwide to engage audiences collectively; football is no exception. It plays a significant role in providing entertainment and promoting social interaction. Due to varying levels of audience engagement, it is challenging to collectively enjoy the pleasure of watching the game. Therefore, this study aims to investigate how data visualization can enhance the experience of audiences with different experiences.The study focuses on the penalty shootout interface in football broadcasts, aiming to assess whether the level of sports engagement among viewers influences the perception, satisfaction, and intent to rewatch through visualizations in the interface. Through a survey of participants' football viewing experiences, 36 participants were invited to participate in physical experiments, comprising 18 high-experience and 18 low-experience participants. The control group had no visualization information added, and the experimental group had five different visualizations: penalty shootout data for both sides, tactical board, shot ball speed, player information, and score - added to the contextual simulation videos. Evaluation methods included: (1)Participants were requested to watch scenario simulation videos and record their behavior and verbal expressions. (2) Participants were required to complete three questionnaires - Perceived Quality, Satisfaction, and Re-viewing Intentions. (3) Task responses and semi-structured interviews were conducted to understand participants' perspectives on the visualization information. (4) A five-point Likert scale was used to evaluate the participants' comprehension and preference for the visualization elements. Results indicated that 97% of participants preferred interfaces with data visualization, believing that adding visualization information contributes to understanding the match situation and enhances the enjoyment and immersion during viewing. We found (1) significant differences in perception between high and low-experience viewers, with higher-experience participants having a greater perception of visualization information, (2) Although the level of understanding of visualization varied between the high and low-experienced respondents, the highest level of understanding of score visualization was found in all of them, (3) From the investigation of five visualizations, it was found that both high and low-experienced participants exhibited similar preferences for visualizations. In descending order, the preference ranking includes player information, penalty shootout data for both sides, shot ball speed, tactical board, and score visualization. (4) There was a significant difference in the level of comprehension and preference among the five types of visualized information. This research suggests that when optimizing interfaces in the future, designers should prioritize design improvements based on preference levels and use evaluations as a reference for subsequent enhancements.
Sporting events have become ubiquitous and ever-growing in modern society (Trail and James, 2001). Internet television broadcasting has allowed sports enthusiasts and general audiences around the globe to cheer for their favorite events collectively. According to a FIFA report (FIFA. 2018), the viewership of 3.572 billion has surpassed half of the global population over four. In 2022, at least 3.262 billion people globally watched at least one minute of the World Cup at home. Approximately 309.7 million viewers tuned in via digital
platforms, and there was a 9.5% increase in the total audience watching in public places like bars and restaurants.
The emergence of new sensing and image processing technologies (Lin et al., 2023) has enabled the addition of visualization features, making results more intuitive (Jin et al., 2023). In contemporary football broadcasts, an increasing amount of statistical data, including scores and time, is dis- played, facilitating quick access to real-time progress for sports and general audiences, enhancing their understanding of the game and increasing their engagement. According to Bilali´c et al. (2011), viewers with higher experi- ence have more background knowledge of the event, enabling them to grasp information content in less viewing time and focus on more comprehensive content, while low-experienced viewers tend to focus more directly on con- tent of interest. However, current televised broadcasts have limited visual data presentation, often not meeting audience experience needs (Lin et al., 2023). Thus, enhancing augmented reality (AR) will change this dilemma, and diverse visual presentations will help audiences understand data infor- mation. The Second Spectrum technology is innovative in updating game data in real-time through AR and visual effects used for game data display (Goebert et al., 2022).
Sports visualization offers a novel approach to exploring, comprehend- ing, and communicating sports data (Perin et al., 2018). Current broadcast interfaces utilize various visualization enhancement elements. These include match backgrounds featuring teams and leagues such as Arsenal against Manchester United, UEFA Women’s Champions League, and the FIFA World Cup. An investigation and analysis of the visualization interface content reveals the inclusion of enhanced elements like Box-score, Tracking data, and Enhanced graphics.
(1) Box-score-refers to data collected and presented in real time during a game or event. This data can include match statistics such as the number of shots, possession percentages, and foul counts. Typically gathered by data analysis firms or broadcasting companies, these statistics are made available to viewers and analysts as the game progresses. This real-time data provision helps audiences better understand the game’s current state and the teams’ performance (Lo et al., 2022). (2) Tracking data-involves real-time analysis using Hawk-Eye cameras and panoramic video systems, providing detailed player information (Deepa et al., 2021). This data includes insights into players’ movement paths, running speeds, and passing behaviors, among other metrics (Perin et al., 2018). Such data is valuable for analyzing player performance, assessing technical skills, and evaluating tactical applications. (3) Enhanced graphics-involve the addition of graphic elements, text, and icons to enhance visual effects and provide additional information (Goe- bert et al., 2022). This includes special visual effects such as slow-motion replays, angle views, and full-field panoramas, offering more detailed and engaging visual presentations (Xue et al., 2017). Predictive paths, created by adding special effects to athletes’ images to illustrate projected movement trajectories, offer viewers enhanced visual information and understanding.
The Impact of Enhanced Information Presentation in Sports Event Broadcasting 303
The study focuses on the Penalty shootout in football matches, a crucial moment that is often decisive for the outcome. Unlike the dynamic nature of regular gameplay, penalty shootouts have a clear and consistent struc- ture each time they occur (Avugos et al., 2020). This study analyzes football broadcast interfaces, examining viewers’ engagement when watching penalty shootouts through broadcasting platforms. By utilizing experimental videos and post-viewing questionnaires, it investigates the impact of information on viewers and validates their preferences and understanding of visualiza- tion information. This research provides insights for future design in sports broadcasting media, aiming to enhance audience immersion in the sports experience.
METHODS
Participants for the experiment were randomly recruited online, and they completed a questionnaire providing basic information and their football viewing experience. A total of 224 questionnaires were collected, with 217 being valid. The study aimed to investigate variations in the perceptions of viewers with different levels of football experience when watching sim- ulated videos. Therefore, participants were selected based on the top and bottom 27% of football experience, leading to 36 participants aged 18 to 65 for the experiment. This included 18 high-experience viewers (M = 24.40, SD = 5.11) and 18 low-experience viewers (M = 66.62, SD = 8.37). An independent sample t-test revealed significant differences between high and low-experience viewers (p = 0.000).
The experimental procedure included: (1) Participants watched a con- text simulation video, initially viewing a traditional non-visualization video followed by three videos (labeled ABC) in random order; (2) Participants completed a scale (Lee et al., 2016) assessing perception quality, satisfac- tion, and re-viewing intention for interfaces with and without visualization information, to understand their thoughts and feelings about the addition of visualization elements; (3) Task-based responses were collected for videos ABC, followed by semi-structured interviews to gauge participants’ views on the visualization elements; (4) A five-point Likert scale was used to eval- uate the participants’ comprehension and preference for the visualization elements.
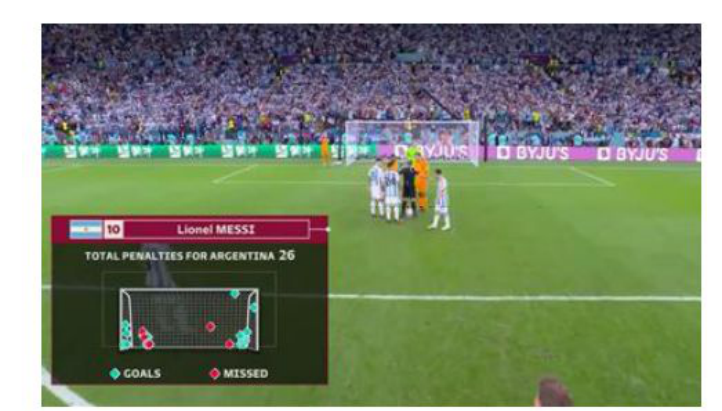
The background for the experimental simulation videos was extracted from a quarter-final match between the Netherlands and Argentina during the 2022 FIFA World Cup. This experiment primarily focused on enhanced elements. The control group viewed the footage without any added visual- ization information, whereas the experimental group was presented with five different types of visualization enhancements in three different scenario simu- lation videos (ABC). These enhancements included data on penalty shootouts for both sides, tactical board, shot ball speed, player information, and score visualization.
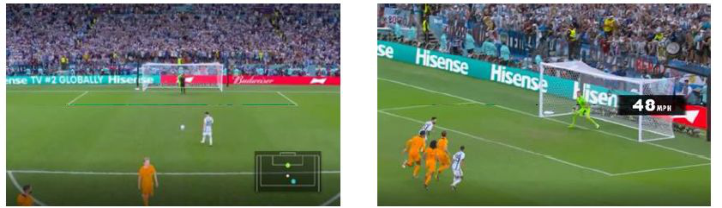
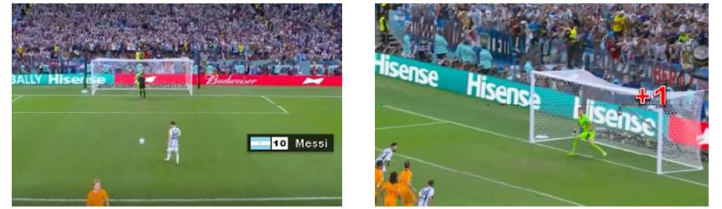
Figure 1: A. Enhanced box-score elements (A1. Penalty shootout data for both sides).Figure 2: B. Enhanced Tracking data. (B1. Tactical board; B2. Shot ball speed).Figure 3: C. Enhanced Graphics. (C1. Player information; C2. Score visualization).
RESULTS AND DISCUSSION
The study findings revealed varied perceptions and opinions among view- ers with different experience levels regarding the existing football broadcast interfaces and visualization information. These findings can be summarized as follows:
The Impact of Enhanced Information Presentation in Sports Event Broadcasting 305
Results of the Scale for Perceived Quality, Satisfaction, and Re-viewing Intentions This study involved three sets of scales, each comprising 12 items, evalu- ated using a 7-point Likert-type response (7 = strongly agree, 1 = strongly disagree). The experimental results indicated that, in the scales measuring perceived quality, satisfaction, and re-viewing intentions, participants with more experience in football viewing scored higher than low-experience view- ers. This difference is attributed to the higher sensitivity and expectations of more experienced viewers towards football. Independent sample T-test results showed significant differences in perceived quality between the high and low-experience groups (p = 0.045). However, no significant differences were found in satisfaction (p = 0.959) and Re-viewing intentions (p = 0.104).
Table 1. The scale for perceived quality, satisfaction, and re-viewing intentions.
Table available in the original PDF paper.
High-experience Low-experience Average t p Perceived Quality 5.57 4.85 5.21 −2.083 0.045* Satisfaction 5.59 5.57 5.58 −0.52 0.959 Re-viewing Intentions 5.59 5.54 5.70 −1.669 0104
* p <.05. ** p <.01. *** p <.001.
Task Performance Our findings revealed that in Task A1, both high-experience and low- experience had similar impressions of the imagery (accuracy rate = 61%). However, 44% of the low-experience needed to fully comprehend its mean- ing, mainly due to their limited understanding of football competitions. In Task B1, 91% of participants reported that they discerned the movement direction of players from the video, not from the visualization information, indicating that the video content alone was sufficient for understanding the match at this stage. Despite not understanding the visualization information, task B2 revealed that 22% of participants could still guess it represented a speed unit. In Task C1, it was observed that participants with high experience in football had a significantly higher accuracy rate than those with low expe- rience, owing to their existing knowledge and familiarity with football rather than the visualization information. However, for low-experience viewers, the visualization information played a significant role.
According to the responses from participants, 91.7% of experienced-level viewers believe that visualization information helped them better understand the progress of the match. Additionally, 75% expressed an increased interest in continuing to watch football broadcasts due to the presence of visualiza- tion information. Some participants noted that visualization added to the tension and immersion, stating that they would not specifically watch a match for the visualization but would avoid watching if it were absent. After view- ing the scenario interfaces, 97% preferred interfaces with visualization over traditional non-visualization interfaces. Experienced viewers mentioned that visualization helps explain things to low-experienced viewers, making details more explicit and emphasizing the importance of understanding the data behind each play in football.
Table 2. Task correct rate.
Table available in the original PDF paper.
Task High- experience
Low- experience
61% 61%
A1 Mapping the Placement of Argentina’s Penalty Kicks
83% 56%
B1 Mapping the Positions of Kickers, Goalkeepers, and Ball Trajectories B2 What is the shot ball speed? 56% 56% Do you understand the unit of shot ball speed? 78% 39% C1 Who is the goal scorer? 100% 78% The jersey number of the goal scorer? 89% 44% Nationality of the goal scorer? 100% 67% C2 Have you seen the C2 visualization? 94% 94% Frequency of visualization effects in broadcast? 67% 78%
Evaluation of Five Visualization Information Elements The 36 participants collectively provided 315 comments on five visualiza- tion elements during the experiment. These comments were categorized into positive and negative feedback and individual content syntheses.
(1) A1 Penalty Shootout For Both Sides Visualization There were 79 evaluations, with 71% being positive reviews. Participants believed this element significantly enhanced the viewing experience and con- tributed to a greater sense of anticipation and speculation about the game, irrespective of their experience level. In the remaining 29% of the evalua- tions, confusion was mainly attributed to a need for more understanding of the information.
(2) B1 Tactical Board Visualization There were 52 relevant evaluations for this element, with 38% being posi- tive reviews. Participants felt that the visual representation of positions added a more intuitive sense of movement and enhanced memory. However, 52% expressed that they could already clearly understand the movement posi- tions in penalty shootouts without the need for this repeated presentation. Meanwhile, 10% believed that it did not provide any assistance.
(3) B2 Shot Ball Speed Visualization There were 60 evaluations in total, with 53% being positive reviews. Respondents appreciated the numerical quantification as it allowed for a better understanding of the game information and increased engagement. However, 47% expressed negative feedback, indicating that they found it ineffective due to a lack of familiarity with speed units and numerical val- ues. They wished for corresponding reference information to enhance the effectiveness of receiving this element’s information.
(4) C1 Player Information Visualization There were 41 evaluations in total, with 72% being positive reviews. The majority of respondents considered this information to be essential. They wanted to know and familiarize themselves with basic player information on the field, including goalkeeper details. However, 28% gave negative feed- back, primarily due to their lack of familiarity with the information, such as
The Impact of Enhanced Information Presentation in Sports Event Broadcasting 307
an inability to identify flags and nationalities. From task-related questions, it was observed that respondents’ correct answers were based on their existing knowledge of players. Among the player information, jersey number informa- tion had the highest error rate. Nevertheless, respondents still acknowledged its importance.
(5) C2 Score Visualization There were 67 evaluations, with 77% of respondents stating that they could discern scoring information from the video and did not require this visualization. They found it disruptive and preferred watching live audience interactions during the game. The presentation style was also considered gamified and more suitable for entertainment-focused video platforms.
Ranking of Comprehension and Preference People with high and low experience rated the five visual elements, con- sisting of the options “Strongly Understanding/Strongly Like” “Understand- ing/Like,” “Neutral,” “ Misunderstanding/Dislike,” and “Strongly Misun- derstanding/ Strongly Dislike” (5 = strongly understanding/strongly like, 1 = strongly misunderstanding/strongly dislike). As indicated in Tables 3 and 4, it is evident that the level of understanding differs from the level of preference. Both high and low-experience individuals share the same preference ranking. In terms of overall preference ranking, the results were consistent for both high and low-experience participants. The rankings, in order, were C1 player information (4.61) and A1 penalty shootout data for both sides (4.22), with participants indicating preferences between “Strongly Agree” and “Agree.” Next, B2 shot ball speed (3.95), and B1 tactical board (3.61) fell between “Agree” and “Neutral,” while C2 score visualization (2.67) was situated between “Neutral” and “Disagree.”
This study investigated whether information presentation in penalty shootout soccer broadcasts affects the viewers’ watching experience. The study find- ings indicate that 97% of the participants expect a visualized information interface. They believe that visualized information helps understand the state of the competition and enhances entertainment value and immersion while watching. However, not all visualized information is suitable for presentation
in the interface. For example, the C2 score visualization element scored the lowest in preference ranking, suggesting that participants are not very satis- fied with the C2 information’s content and presentation format. We observed the following: (1) According to the perception scale, there were significant differences in the perception levels between high and low-experience viewers, with high-experience viewers perceiving visual information more effectively. (2) Despite differences in visualizations between high and low-experience viewers, both groups showed the highest comprehension of score visu- alization. (3) Among the five visualizations surveyed, high and low-experience view- ers displayed same preferences. The preference ranking was as follows: player information, penalty shootout data for both sides, shot ball speed, tactical board, and score visualization. (4) Future interface optimizations should prioritize design improvements based on preference levels. Perhaps timing or presentation format enhancements can be made for the penalty shootout data for both sides and the player information presentation. Experiment evaluations can serve as a reference for subsequent improvements.
REFERENCES
Avugos, S., Azar, O. H., Sher, E., Gavish, N., & Bar-Eli, M. (2020). The Right- Oriented Bias in Soccer Penalty Shootouts. Journal of Behavioral and Experimen- tal Economics, 89, 101546. https://doi.org/https://doi.org/10.1016/j.socec.2020. 101546 Bilali´c, M., Kiesel, A., Pohl, C., Erb, M., & Grodd, W. (2011). It Takes Two–Skilled
Recognition of Objects Engages Lateral Areas in Both Hemispheres. PLOS ONE, 6(1), e16202. https://doi.org/10.1371/journal.pone.0016202 Deepa, N., Naresh, R., Kanchana, M., Pandiaraja, P., & Stephan, T. (2021). Secure Recommendation System for Healthcare Applications Using Artificial Intelligence. Evolving Role of AI and IoMT in the Healthcare Market, 47–59. FIFA. (2018). More than half the world watched record-breaking 2018 World Cup.
The FIFA Website: https://inside.fifa.com/tournaments/mens/worldcup/2018russi a/media-releases/more-than-half-the-world-watched-record-breaking-2018-wo rld-cup Goebert, C., Greenhalgh, G., & Dwyer, B. (2022). A whole new ball game: Fan perceptions of augmented reality enhanced sport broadcasts. Computers in Human Behavior, 137, 107388. https://doi.org/https://doi.org/10.1016/j.chb. 2022.107388 Jin, P., Ge, Z., & Fan, T. (2023). Research on visual search behaviors of basketball
players at different levels of sports expertise. Scientific Reports, 13(1), 1406. https: //doi.org/10.1038/s41598-023-28754-2 Lee, M., Kim, D., Williams, A. S., & Pedersen, P. M. (2016). Investigating the role of sports commentary: an analysis of media-consumption behavior and programmatic quality and satisfaction. Journal of Sports Media, 11(1), 145–167. Lin, T., Chen, Z., Yang, Y., Chiappalupi, D., Beyer, J., & Pfister, H. (2023). The
Quest for: Embedded Visualization for Augmenting Basketball Game Viewing Experiences. IEEE Transactions on Visualization and Computer Graphics, 29(1), 962–971. https://doi.org/10.1109/TVCG.2022.3209353
The Impact of Enhanced Information Presentation in Sports Event Broadcasting 309
Lo, W. H., Zollmann, S., & Regenbrecht, H. (2022). Stats on-site — Sports spectator experience through situated visualizations. Computers & Graphics, 102, 99–111. https://doi.org/https://doi.org/10.1016/j.cag.2021.12.009 Perin, C., Vuillemot, R., Stolper, C. D., Stasko, J. T., Wood, J., & Carpendale, S.
(2018). State of the Art of Sports Data Visualization [Article]. Computer Graphics Forum, 37(3), 663–686. https://doi.org/10.1111/cgf.13447 Trail, G., & James, J. (2001). The Motivation Scale for Sport Consumption: Assessment of the Scale’s Psychometric Properties. Journal of Sport Behavior, 24, 108–127. Xue, Y., Song, Y., Li, C., Chiang, A. T., & Ning, X. (2017, 24–31 March 2017).
Automatic Video Annotation System for Archival Sports Video. 2017 IEEE Winter Applications of Computer Vision Workshops (WACVW).
LISTED IN THE AHFE DIGITAL BOOKSTORE CATALOGUE
Explore the complete digital volume
Human Factors and Systems Interaction
Read this individual research paper free through the original publisher, or explore the full digital proceedings book.
ISBN 978-1-964867-30-4
Explore this ISBN in the AHFE Bookstore ↗Listed in the July 2026 bookstore catalogue; search by ISBN to confirm current availability · Digital book purchase optional