Wojciech Bonenberg (2018). A Method of Assessing Public Space Attractiveness with use of Google Maps. In: Advances in Human Factors and Sustainable Infrastructure. AHFE Open Access, vol. 3. https://doi.org/10.54941/ahfe100104
The paper presents results of research on the quality of public space within Poznan Metropolitan Area. To identify this phenomenon an original method of analysis of World Wide Web was applied. The method is characterized by a high fidelity in diagnosing the character of relations. By means of applied research tools it was possible to analyse visual and functional interactions. The result is a map presenting the attractiveness of public spaces throughout Poznan Metropolitan Area based on a scope of specialised services and their distribution within the city in relation to visual quality of public space.
PROBLEM The use of geospatial data on the Internet is becoming more and more common. Spatial information consists in the geographic location (geographical coordinates in the adopted reference system) and relations that are relevant in the context of the content presented on websites. Descriptive information is increasingly related to maps referring to the geographic location of presented content as well as their visualization in the form of videos, images, satellite and aerial photographs, panoramas taken from the street level and even three-dimensional models of buildings and streets. It is possible to use it with GPS receivers, search for different kinds of services and plan access roads. Search engines display administrative borders and transport routes: railway, roads, bus and tram routes. One can access in- formation about the traffic and travel time. Search engines have access to the database of companies operating in a given region and to real estate offers. They place information from Wikipedia on the map (e.g. about monuments, natural features of historic importance, valuable landscapes). This information is then systematically updated by In- ternet users in the form of YouTube videos, pictures, descriptions and comments placed on the maps. One example is that of Google search engine. It gives the opportunity to find places on Google Maps and watch the actual view in Google Earth and Street View. Websites are supported by fast navigation tools and search engines are geared to- wards the ease of use and time-saving rather than detailed product descriptions (Hall, Hall, 1990). During the past 20 years, the content of websites has seen significant transformation. Their target group has changed from business users to individual customers – the consumers of essential services. The importance of the Internet in marketing communication and advertising strategies has increased. The influence of on-line information on consumer behavior has been confirmed in many studies (Hermeking, 2005, Holden, 2004).
At the same time, the possibility to use data that is contained on the web in spatial planning and urban design has been much less explored. This applies, in particular, to urban planning and to studies involving the conditions and trends of spatial development. The rich database of descriptive and visual information combined with geographic lo- cation is a valuable source of information for urban planning analyses, including:
- the analysis of land development,
- spatial segmentation of analyzed phenomena and their assessment,
- the integration of scattered descriptive, geospatial and visual data representing spatial, economic, social and cul- tural phenomena.
By means of a Web query one can track the dynamics of changes in land development and monitor the implementa- tion of planned arrangements.
Web query is particularly useful for the geographic location of service, production and settlement activity in urban areas and for the assessment of the quality of the landscape. This data is characterized by validity and largely comes from the residents and tourists who use the Internet to share their opinions. A separate set of data is the information from service providers and entrepreneurs who advertise their businesses on the Internet. Companies that do not have websites but still want to be visible on-line can create a business card on Goggle Maps, showing their location, the type of service provided, and key information about their business activity.
Search engine optimization technology (SEO) facilitates the search of this information as it aims for websites to achieve the highest search result for selected keywords and key phrases with the possibility to position them geo- graphically (GIS Web Solutions).
These tendencies are consistent with new trends in urban planning. More and more local governments are beginning to recognize the importance of the way urban space is perceived in the micro scale (ergonomics of public space) and the impact of this perception on the assessment of urban policy. It is a new approach to urban space management which is connected with the philosophy of “bottom-up” approach, from the perspective of the man in the street, rather than the “top-down” approach, from the perspective of planning authorities. It is believed that this kind of ap- proach can be helpful in forming spatial policy and undertaking administrative measures which are aimed at improv- ing the quality of life. As emphasized by Neacsu (2009), this approach is appreciated by the residents. Neacsu notes that standard planning methods, on their diagnostic level, do not give a complete picture of spatial and social reality. The micro scale level, seeing the street from the perspective of local residents, is an effective tool facilitating urban space management.
Planning procedures based on “top-down” analyses significantly outdistanced the methods of the diagnosis of com- positional quality, spatial order, directly affecting the perception of urban space.
METHOD
This paper presents an original method of evaluation of urban attractiveness of public space in the city with the use of web query. The method was developed at the Faculty of Architecture at Poznan University of Technology and used to measure urban attractiveness of public space in the Poznan Metropolitan Area. The method assumes that ur- ban attractiveness, as interpreted by city residents and tourists, is based on two main phenomena:
- functional quality,
- visual quality.
In the eyes of the inhabitants, various parts of the city differ in terms of their functionality and visual quality, which creates a mental image of the attractiveness of those places. Under this assumption, public space in the city can be perceived in two ways. First, it is to satisfy the necessities of everyday life, it has specific functional purpose. Sec- ond, the way public space looks evokes certain feelings associated with form, composition, color, etc. We can expe- rience positive aesthetic emotions enjoying the appearance of some part of the city, at the same time having other impressions while using its functional attributes. Therefore, when an element of urban space evokes admiration because it looks good, it does not determine our satisfaction with its practical ability to meet specific functional needs (Bonenberg, 2011). This is the reason for which in the evaluation of the attractiveness of public space, it is necessary to combine the functional and visual criteria. Thus defined attractiveness diversifies urban space and as a result some neighborhoods are rated higher than others. Such diversification affects the price of real estate and investment decisions as well as being an important factor in creating the spatial policy of the city.
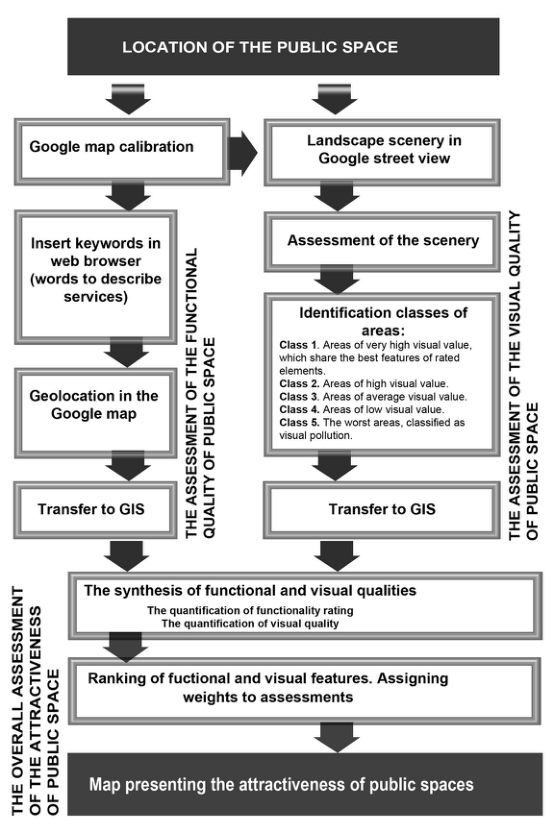
Rating urban attractiveness of public space by means of web query includes the following elements (see Figure 1): A. The assessment of the functional quality of public space.
B. The assessment of the visual quality of public space.
C. The overall assessment of the attractiveness of public space. The synthesis of functional and visual qualities.
Figure 1. Rating urban attractiveness of public space by means of web query. Methodological steps
A. The evaluation of the functional qualities of public spaces Web query (Goggle maps) has led to the geographic location of service activity that occurs in Poznan Metropolitan Area and is presented on the Internet (Bonenberg, 2012). 196 types of services were found and grouped into 16 cate- gories:
1. Places of worship: churches, chapels, sanctuaries, monasteries.
2. Health services: hospitals, clinics, medical centers, local clinics, outpatient clinics, medical offices, the dentist’s, pharmacies.
3. Trade – basic function: grocery stores, the butcher’s, bakeries, pastry shops, the greengrocer’s, drugstores, deli- catessen, florist’s, newsagents.
4. Basic services: hairdressers, beauty salons, solariums, beauty studios, shoe repair services, tailoring services, re- pair of household appliances, repair and maintenance of electronics.
5. Trade – central functions: car showrooms, jewelry, furniture stores, computer stores, cell phone stores, music stores, medical stores, clothing stores, shoe and sports stores, the optician’s, boutiques, toy shops, children's shops, perfumeries, bookstores, stores with construction and installation materials, supermarkets.
6. Architecture, art and design: website design, computer programming, fashion design, jewelry design, garden and greenery landscaping, architectural design, building design, design of roads and streets, installation design, interior design, artistic design, art galleries, antique shops, recording studios, advertising agencies, photographic studios, television studios, printing services, services in the field of maintenance and restoration of monuments.
7. Culture and entertainment: theatres, concert halls, exhibitions, museums, libraries, cinemas, clubs, discos, cultural centers, community centers, architectural monuments, parks of historic value.
8. Specialized services: notary offices, law firms, legal counselling, accounting offices, Public Relations agencies, marketing agencies, consultancies, translation agencies, real estate agencies, real estate developers, GPS navigation, freight forwarding and logistics services, travel agencies, courses, events, conference services, repair and renovation, construction services, system installation services, surveying and geotechnical services, veterinary clinics.
10. Automotive and transport services: car rental, used car dealers, second-hand car sale, car repair, vehicle diagnos- tics, motorcycle repair, bike repair, gas stations and car parks.
14. Education: kindergartens, elementary schools, vocational schools, junior high schools, technical colleges, music schools, high schools, universities, foreign language schools.
15. Administration, municipal offices and institutions: municipal offices, district offices, tax offices, registry offices, post offices, National Insurance System offices and the offices of the Agricultural Insurance Fund, police stations, fire brigades.
16. Other: hospices, care centers, nursing homes, occupational therapy centers, educational centers, associations and foundations.
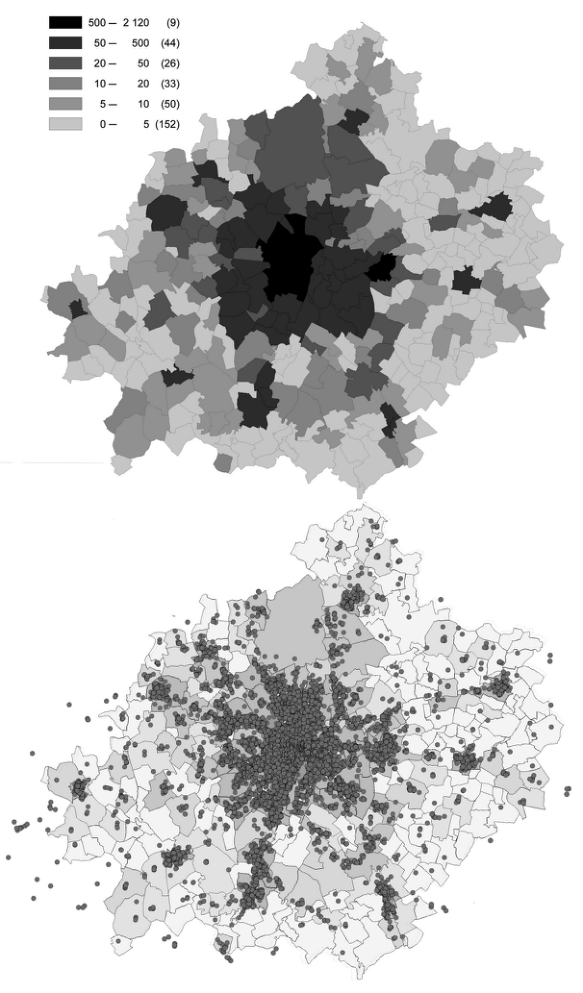
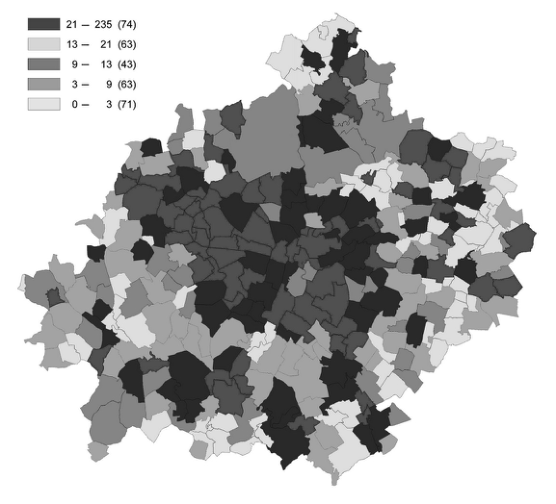
The analysis of such a highly diversified functional spectrum required the creation of a database consisting of nearly eighteen thousand cases, which is much more than the average sample in comparable studies. Location data was an- alyzed by means of the Geographic Information System according to selected criteria showing the ratio of the num- ber of services to population, municipality area as well as surveying districts. The results are presented on thematic maps (see Figure 2). One can indirectly read from them the level of the saturation of services, the urban diversifica - tion of service functions and the scope of the use of modern means of promotion and advertising of businesses in Poznan Metropolitan Area.
Figure 2. Spatial distribution of services shown on the World Wide Web in Poznan Metropolitan Area
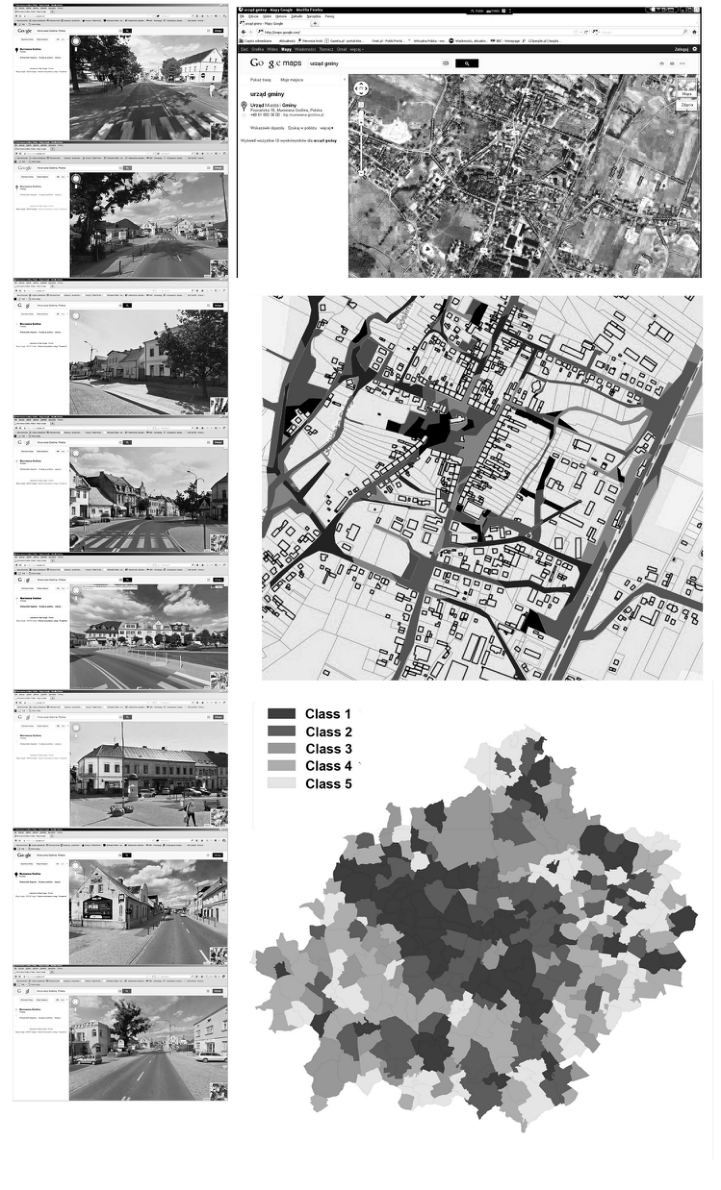
B. The assessment of the visual quality of public space Google Street query has led to the evaluation of the landscape. The measurement of visual quality was based on the assumption that visual impressions are determined by five basic elements of public space:
- the surface of the roads, streets and sidewalks (material, color, texture, maintenance),
- facades of the ground floors in tenement houses (storefronts, entrances to buildings, architectural detail, ornament, relief, signs of vandalism in the form of graffiti),
- higher parts of the facades (how they fit in the context of the surrounding landscape, the maintenance of facades, balconies, bay windows, cornices, visual pollution in the form of advertisements and banners),
- city planning details: monuments, benches, litter bins, bus and tram stops,
- greenery and water: the composition and maintenance of flower beds, hedges, trees, fountains, pools, ponds and lakes.
The analysis of the visual impact was performed by means of the expert method, it covered the entire metropolitan area and was based on representative images obtained with the use of Google Street search engine.
In the study, the appearance of the above-mentioned elements of public space were an independent variable while the visual impressions constituted dependent variables. The relations between the appearance (independent variable) and visual impressions which it produces were analyzed. All variables were qualitative. It should be noted that the relations between the appearance of the elements of public space and visual impressions are probabilistic.
In the study, the author used the assessment of 10 raters (expert rating), which contributed to the increase of rating reliability. Assessment consisted in the assignment of visual impressions to each of the above-listed elements of public space. The procedure was applied for each view in a representative sample.
The study was conducted with the use of questionnaire survey. In order to measure the relations between the appear- ance of the elements of public space and visual impressions, a five-point Likert scale was used (Kłeczek et al., 2006). Expert ratings (consisting in their intuitive convictions) were quantified in the range of 1-5 points, showing the intensity of the visual impression evoked by each of the five elements of public space presented in Goggle Street. The experts were asked to fill out the survey. The advantage of this technique is the speed of data collection and the possibility of further processing.
The result provided a synthetic visual characteristic of each area under review. Five classes of areas emerged.
Class 1. Areas of very high visual value, which share the best features of rated elements.
Class 2. Areas of high visual value.
Class 3. Areas of average visual value.
Class 4. Areas of low visual value.
Class 5. The worst areas, classified as visual pollution.
The results are shown on the map (see Figure 3).
Figure 3. The assessment of the visual quality of public space with use of Google Street view
C. The overall assessment of the attractiveness of public space. The synthesis of functional and visual qualities The overall rating of attractiveness was obtained by the synthesis of (adding up) the data referring to functional and visual quality. In order to do that, the following operations have been undertaken:
- the quantification of functionality rating in a 1-5 point scale by assigning 1 point to the areas that are the worst equipped in services and 5 points to the best equipped areas,
- the quantification of visual quality ratings in a 1-5 point scale by assigning 1 point to spaces that are the worst from the visual point of view (class 5), and 5 points to spaces classified as class 1.
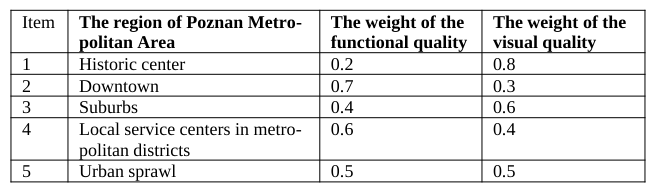
It should be noted that in various parts of the city the importance of visual and functional qualities is different. The following types of areas were marked off: the historical center, the downtown, the suburbs, local service centers in metropolitan districts, urban sprawl. The visual and functional features of each area were assigned specific weights in the overall rating of the attractiveness of public spaces. For this purpose, the Paired Comparison Analysis was used (David, 1988). The following results were obtained (see Table 1).
Table 1: Weights of visual and functional features in the overall rating of the attractiveness of public spaces in various parts of the Poznan MA
After the insertion of hierarchized synthetic ratings to GIS, a map presenting the attractiveness of public spaces throughout Poznan Metropolitan Area was obtained (see Figure 4).
Figure 4. Map presenting the attractiveness of public spaces throughout Poznan Metropolitan Area
THE ADVANTAGES OF THE PROPOSED METHOD The advantage of this method is the possibility to assess the attractiveness of urban public spaces relatively quickly and without the high costs associated with traditional urban survey. An important feature is the validity of urban de- velopment data obtained systematically from the Internet as compared to professional geospatial databases referring to the location of service activity. For example, the address data from the statistical office shows the official location of service providers in the metropolitan area. These are the addresses where official company seats are registered and this data is primarily used for the purposes of tax records. In many cases, the actual services are provided in dif- ferent locations. This especially applies to restaurants and chain stores that have a single address in statistical data- base (the registered office of the company) and, at the same time, many service points scattered in the city (not ex- posed in statistical databases). What is more, many entities from the creative industry have their registered offices and actual service points located in two different places. For a meaningful evaluation of the saturation of public spa- ces with services the places of actual provision of services are important and this data is presented on websites.
In terms of the visual analysis, Google Street allows for reliable visual assessment of public space. Its advantage is the possibility to conduct a comparable visual analysis of different parts of the city, regardless of the time of the day, season or weather conditions. In addition, the visual analysis can be completed with images obtained from Wikipedia and Goggle Images.
CONCLUSIONS
In Poznan Metropolitan Area there is a clear diversification of the attractiveness of public space. The research has led to the identification of locations where the perception of public space is negative. One important problem is the visual pollution of public space with graffiti on the ground floors of tenement houses and large advertisement ban- ners on the upper floors of the buildings. The maps of urban attractiveness can be the basis for:
- the evaluation of investment competitiveness of various regions of the metropolitan area, with particular considera- tion of the location of creative services,
- the comparison of actual results of metropolitan area management with previous plans (recorded in current studies of the conditions and directions of the development of communes in Poznan District),
- the correction of Poznan Metropolitan Area spatial development trends in terms of the functional program and the identification of investment priorities,
- the assessment of the extent of use of modern means of promotion and advertising by businesses in Poznan Metro- politan Area.
REFERENCES
Bonenberg, A. (2011), “Beauty of the city – Urban empathy. Case study – Catania in Sicily”, Poznan: FA, Poznan University of Technology. pp. 46-52 Bonenberg, W. (2012), “Applying World Wide Web query to diagnose the spatial distribution of services in Poznan Metropolitan
Area”. in: The urban Landscape Renewal, Vol 2. FA, Silesian University of Technology. pp. 31-36 David, H.A. (1988), “The Method of Paired Comparisons”. NY: Oxford University Press. Hall, E. T., Hall, M.R. (1990), “Understanding Cultural Differences: Germans, French and Americans”, Yarmouth: Intercultural Press. Hermeking, M. (2005), “Culture and Internet Consumption: Contributions from Cross-Cultural Marketing and Advertising Re-
search”, Journal of Computer-Mediated Communication. Volume 11 Issue 1. pp. 192-216 Kłeczek, R., Sagan, A. (2006), “Techniki pomiaru wizerunku marki – badania jakościowe”, in: Krall, J., Kłeczek, R., Sagan, A.
Zarządzanie marką. Kraków: Oficyna Ekonomiczna. Mueller, B. (2004), “Dynamics of International Advertising: Theoretical and Practical Perspectives”. NY: Peter Lang. Neacsu, M.C. (2009), “The city image and the local public administration: a working tool in urban planning”, Transylvanian Review of Administrative Sciences, 27E/2009. pp. 172-188
LISTED IN THE AHFE DIGITAL BOOKSTORE CATALOGUE
Explore the complete digital volume
Advances in Human Factors and Sustainable Infrastructure
Read this individual research paper free through the original publisher, or explore the full digital proceedings book.
ISBN 978-1-4951-2092-3
Explore this ISBN in the AHFE Bookstore ↗Listed in the July 2026 bookstore catalogue; search by ISBN to confirm current availability · Digital book purchase optional