Tomoya Koishi, Keiichi Watanuki, Yusuke Osawa (2023). Effects of Field-of-View Expansion Using a Wide-Field HMD on Sensibility During Straight-Line Video Viewing. In: Affective and Pleasurable Design. AHFE Open Access, vol. 71, pp. 28–38. https://doi.org/10.54941/ahfe1003241
Visual information is considered particularly important among the information that humans receive from the external world, because of its significant impact on human mental activity, including self-position and self-motion perception, impressions, moods, situational judgment, and decision-making. Therefore, we conducted a study to investigate the effects of expanding the field of view (FOV) that receives visual information on human mental activity. In the study, we created three types of visual environments in a virtual space and used image processing to expand the FOV of videos that move straight through each environment. We then conducted an experiment to explore how expanding the FOV affected viewers' impressions of the visual environment and their mood. The results showed that expanding the FOV increased the sense of dynamism and spaciousness of the visual environment, and led to improvements in viewers' activation and arousal levels. These findings suggest that expanding the FOV not only enhances the impression of the visual environment but also has the potential to change viewers' mood to a more energetic state.
Recently, there has been increasing attention on human augmentation tech- nology that aims to enhance existing human abilities and discover new ones through integration of advanced technology and human capabilities. Among these technologies, we attempted to extend the capabilities of human vision, which are closely associated with cognitive functions and mental activities. Human vision can process various types of information about external obje- cts, such as their colors, shapes, sizes, and positions (Fujinaga, 2013). The processing results are known to have an impact on many mental activities, including the perception of one’s own and others’ movements, impressi- ons, moods, situational judgment, and decision-making (Kano, 1991; Ikeda, 2008). The field of view (FOV) is defined as the limit of the range in which such visual functions are exerted. The range of the FOV is generally
Effects of Field-of-View Expansion Using a Wide-Field HMD on Sensibility 29 considered to be approximately 200
horizontally and 130
vertically, and it can be said that changes in the visual information within this range can lead to changes in human mental activity. With this in mind, the concept of “FOV expansion” attempts to artificially extend the limits of human visual perce- ption by compressing a wider range of visual information and presenting it to the human eye, thus influencing visual function and mental activity.
In our previous study (Koishi, 2022), we developed a real-time FOV expan- sion system that used a wide-field head-mounted display (HMD) with a diagonal visual angle of 200
, two omnidirectional cameras, and a control PC. We investigated the effects of FOV expansion on the perception of motion during walking. The experimental results showed that as the FOV expanded, the participants tended to perceive themselves as walking faster and cove- ring a shorter distance than they actually did. These findings suggest that FOV expansion can create an illusion of improved physical ability and could be applied to assistive technology or behavioral control based on cognitive scientific approaches. However, the effects of changes in visuospatial and motion perception on human impressions, mood, and body movements are not fully understood. Furthermore, to advance FOV expansion as a more practical technology, several issues need to be carefully examined, such as whether there are negative effects on psychological states and whether there is an optimal FOV angle depending on the purpose, usage context, and other important factors.
Based on the above considerations, the objective of this study is to investi- gate the impact of FOV expansion on human sensibility, i.e., the impressions and moods generated from visual perception. For the experiment, three virtual visual environments and videos of constant-speed straight motions within each environment were created. Viewers’ impressions and moods tow- ards the visual environment were compared by presenting the videos at dif- ferent viewing angles. The subjective evaluations of impressions and moods were conducted using two types of questionnaires and electrocardiographic data.
CREATION OF VISUAL ENVIRONMENT AND STRAIGHT-LINE VIDEO FOV expansion technology has various applications, such as improving exploration efficiency by increasing the visible range and detecting dangers hidden in blind spots. Among these applications, we aimed to apply FOV expansion technology to kinetic situations, such as walking and exercise. Therefore, in this study, we investigated the impact of FOV expansion on sensibility generated by straight walking. However, conducting experiments in a real-world environment may cause factors other than vision to influence the sensory experience, and maintaining consistency in the visual environ- ment and walking speed among the participants may be difficult. Thus, we simulated the visual experience during walking by instructing the participants to watch a video of straight walking in a virtual visual environment.
To create a visually immersive environment, we utilized Unreal Engine 5 (ver_5.0.3), a game engine that provides realism and vividness, and prepared a 3D virtual environment that closely resembled real-world environments.
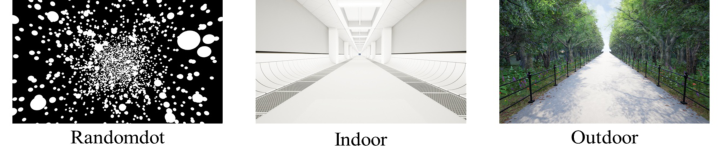
Given the difficulty of generalizing real-world environments, we created three types of environments, as depicted in Figure 1. A random dot environment is the simplest environment that represents visual information in the real world as a collection of point clouds. The indoor environment was designed to resemble a corridor surrounded by floors, walls, and ceilings and was a simplified environment of indoor facilities, such as offices and schools that were used daily. The outdoor environment was designed to resemble a wal- king path surrounded by the ground, nature, and sky and was a simplified street environment (commonly seen in daily life). The width of the road was standardized to 6 m for both the indoor and outdoor environments.
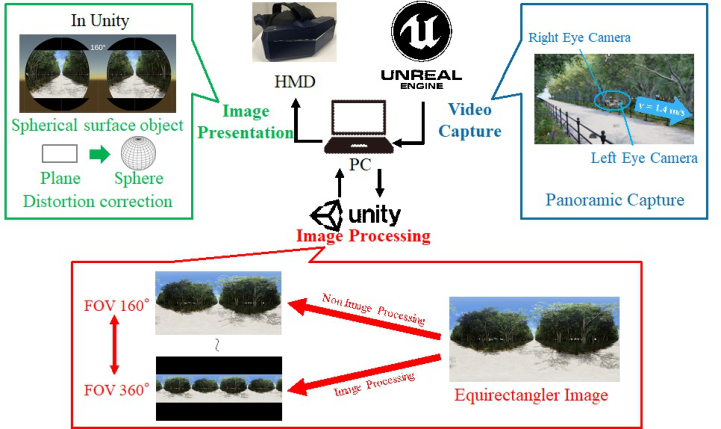
As for the straight-line video, a camera that moved straight for 10 s at an average walking speed of 1.4 m/s for adult men was set up in each of the three visual environments described above, and filming was performed in the game engine. Two cameras were positioned at a distance of 65 mm (i.e., the typical distance between human pupils) to capture a straight video of the right and left eyes. Stereoscopic vision was achieved by presenting each video to the corresponding eye. In addition, the video was output in an equirectangular format by performing 360
filming. By applying image
Figure 1: Created visual environments.Figure 2: Creation flow of straight-line video.
Effects of Field-of-View Expansion Using a Wide-Field HMD on Sensibility 31
processing to expand the FOV to this image format, the FOV angle can be freely changed from a minimum of 160
to a maximum of 360
. The height of the camera from the ground was standardized to 1.7 m for both the indoor and outdoor environments.
The captured video had a frame rate of 30 Hz and resolution of 4096 × 2048 pixels. We used the Unity game engine (ver_2021.3.16f1) to perform image processing on the video and texture mapping to match the lens shape of the wide FOV HMD,thereby simulating the visual experience during walking. Figure 2 summarizes the steps of the process.
EVALUATION INDEX OF FOV EXPANSION EFFECT ON SENSIBILITY Impression Evaluation During Video Viewing
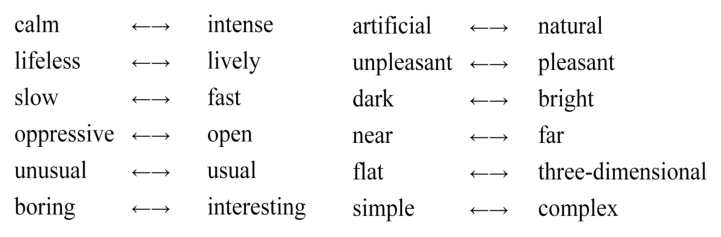
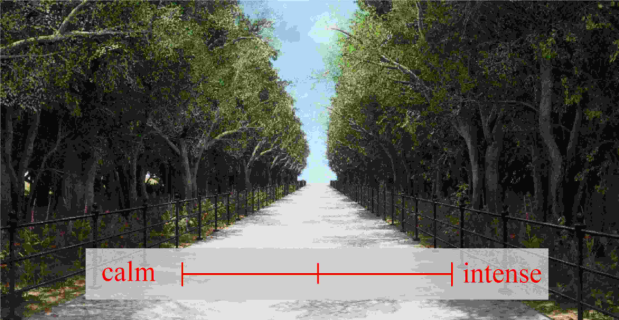
To evaluate the participants’ impressions of the video stimuli, we used a visual analog scale (VAS) subjective evaluation questionnaire. The question- naire consisted of 12 pairs of sensibility words selected from previous studies (Tazaki, 2003; Fujita, 2008; Fukue, 2012) investigating impressions during video viewing (Figure 3). Each pair of sensibility words was placed at either end of a 1000-point slider, as depicted in Figure 4. The participants were able to move the slider’s bar along the continuum to indicate their impres- sion ratings, which were output as values ranging from 0 to 100 (including one decimal place). Using these values, we compared the impressions of the participants towards the video stimuli.
Mood Measurement Before and After Video Viewing To measure mood before and after viewing the video, we used a two- dimensional mood scale (TDMS) developed by Sakagami et al. (2003). This scale consists of four sub-scales, i.e., “Vitality,” “Stability,” “Pleasure,” and “Arousal,” which can measure various psychological states, such as depression, anxiety, vitality, and relaxation in a comprehensive manner. The participants responded to eight questions about their mood using a 5-point Likert scale ranging from 0 to 5, and their responses were converted into the four aforementioned subscale scores using a predetermined formula. Table 1 lists the psychological states of each subscale. By calculating the differences
Figure 3: Sensibility word pairs used to evaluate impressions.Figure 4: Response method for impression evaluation.Table 1. Psychological states indicated by each subscale.
Table available in the original PDF paper.
Scale Mood State Vitality Levels of psychological states with a range between comfortable excitement and unpleasant calmness. A positive score indicates an energetic and lively state, while a negative score indicates a tired and unenergetic state. Stability Levels of psychological states with a range between comfortable calmness and unpleasant excitement. A positive score indicates a relaxed and peaceful state, while a negative score indicates an irritated and tense state. Pleasure Overall comfortable level of psychological states with a range between pleasant and unpleasant. A positive score indicates a comfortable and positive mood, while a negative score indicates an uncomfortable and negative mood. Arousal Overall level of arousal of psychological states with a range between excitement and calmness. A positive score indicates an excited and lively state, while a negative score indicates a sleepy and inactive state.
in the subscale scores before and after watching the video, we compared the mood changes of the participants due to video viewing.
Additionally, electrocardiogram measurements were conducted to assess changes in the autonomic nervous system before and after video viewing. However, the details of these measurements are omitted in this paper.
EXPERIMENTAL EVALUATION OF FOV EXPANSION EFFECT ON SENSIBILITY WHEN VIEWING STRAIGHT-LINE VIDEO The purpose of this study was to investigate the effects of FOV expansion on sensibility induced by visual stimuli during forward walking. The study was conducted with 10 male participants (22.8 ± 0.79 years old) who did not have their vision corrected with glasses. Six conditions of visual field expansion angles were tested, i.e., 160
, 200
, 240
, 280
, 320
, and 360
.
Effects of Field-of-View Expansion Using a Wide-Field HMD on Sensibility 33
Figure 5: Task schedule.
The 160
condition refers to the FOV when no image processing was applied to the video. Three visual environments were used—random dots, indo- ors, and outdoors—resulting in 18 combinations of visual stimuli and field angles.
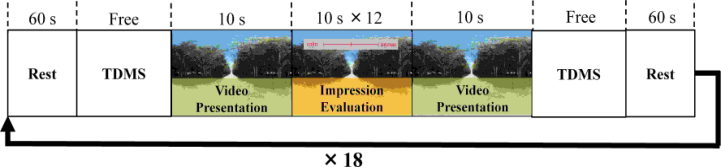
The experimental procedure is illustrated in Figure 5. First, the participant took a 60-s rest with closed eyes, followed by mood measurements using the TDMS. Next, the participants watched a video under conditions randomly selected from the 18 different video presentation conditions. A straight-line video of 10 s was played repeatedly for 14 loops, during the 12 loops in betw- een the first and last loop, a VAS questionnaire for evaluating impressions of the video was displayed. The impression evaluation items changed every 10 s, and the participants answered the questions using a controller. After comple- ting the impression evaluation and video watching, mood measurements were performed using the TDMS, and the participants took a 60-s rest with closed eyes. The same procedure was repeated for all 18 video presentation con- ditions. All trials were performed in a seated position and the participants were instructed to keep their heads facing forward and fixed during video viewing.
RESULTS
Experimental Results on Impression Evaluation To extract a group of sensibility word pairs (common factors) that changed depending on the viewing angle and visual environment for the 12 sensi- bility word pairs, we conducted a factor analysis using observation data from the impression evaluation questionnaire, consisting of 2160 data points (i.e., 6 types of viewing angle conditions × 3 types of visual environment conditions × 10 participants × 12 types of sensibility word pairs). We per- formed a promax rotation of the factor axes to convert the factor loadings obtained from the factor analysis into a simple factor structure assumed to have a correlation between factors. The factor loadings obtained from the factor analysis are presented in In the table, we classified each sensory word pair using the absolute maximum value among the three factor loadings and arranged them in descending order of the absolute value within each factor.
The first factor was interpreted as the dynamic factor since the factor loa- ding for sensory word pairs, such as “lifeless - lively” and “calm - intense,” was large. The second factor was interpreted as the ordinariness factor given that the factor loading for sensory word pairs, such as “artificial - natural”
and “unusual - usual,” was large. The third factor was interpreted as the spa- ciousness factor because the factor loading for sensory word pairs, such as “oppressive - open” and “close - far,” was large.
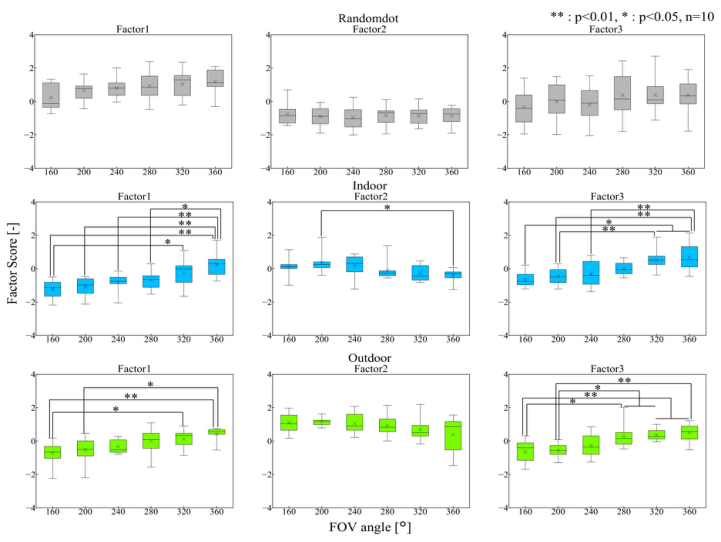
Next, we calculated the factor scores for the observed data using the factor structure obtained from factor analysis. The factor scores represent the extent to which the observed data are influenced by each factor. This enabled us to analyze which factors of the visual stimuli influenced the observed data for each condition. Figure 6 shows boxplots of the relationship between the FOV angle and factor scores for each visual environment. We conducted Tukey– Kramer multiple comparison tests on the mean values of the factor scores among the FOV angle conditions. The results are shown in Table 3.
Figure 6: Relationship between FOV angle and factor scores.Table 2. Factor loadings on impressions of straight-line video.
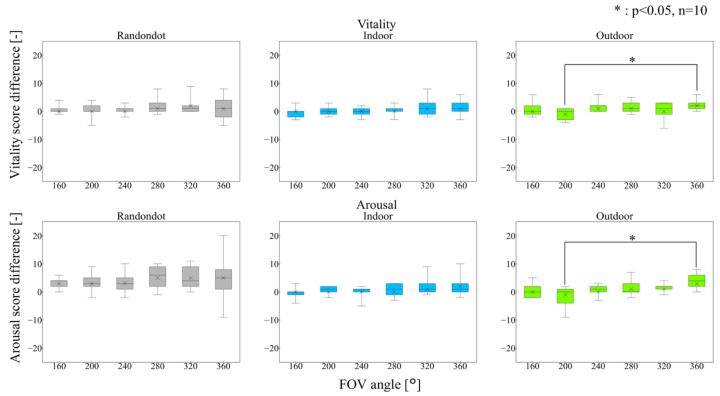
Experimental Results on Mood Measurement To investigate the relationship between FOV expansion and mood changes, we calculated the differences in scale scores (scale scores after watching the video - scale scores before watching the video) using the results of mood measurements obtained by TDMS conducted before and after video viewing. For vitality scale and arousal scale, we created boxplots showing the rela- tionship between the FOV angle and scale score difference for each visual environment, as shown in Figure 7. We conducted Tukey–Kramer multiple comparison tests for the mean differences in scale scores among FOV angle conditions and found a significant difference between the 200
and 360
conditions in the vitality and arousal levels for the outdoor environment.
Figure 7: Relationship between FOV angle and scale score difference for each visual environment.
DISCUSSION
Impression Evaluation From the comparison of factor scores between FOV angles for indoor con- ditions, the first factor score significantly increased with an increase in the FOV angle, whereas the second factor score significantly decreased; additio- nally, the third factor score significantly increased. Similarly, the comparison of factor scores between FOV angles for the outdoor conditions showed that the first factor score significantly increased with an increase in viewing angle, while the third factor score significantly increased. As factor scores indicate the degree of influence that the observation data receive from factors, the above results represent changes in the characteristics (factors) of the ima- ges. Therefore, combining these results with the interpretation of each factor shown in Table 2, we conclude that the image processing of expanding the viewing angle increased the dynamism, non-routine feeling, and openness of indoor images, and increased the dynamism and openness of outdoor images. Moreover, because these images were projected onto the viewer’s entire FOV through an HMD, the change in the images could be considered equivalent to a change in visual perception. Therefore, it is expected that similar effects will appear in visual perception while walking in a real-world environment with an expanded FOV.
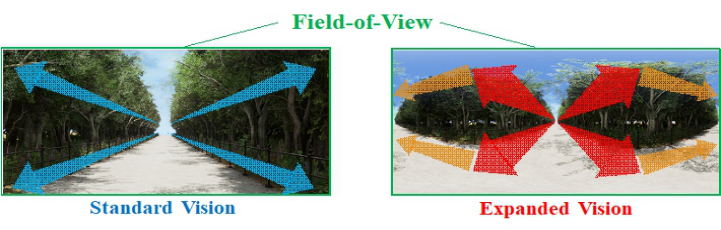
Two factors that could be considered as causes of changes in impression observed in this experiment are the depth variation of the visual environ- ment due to the image processing of FOV expansion, as well as the vector variation of the velocity of visual information. With the image processing of FOV expansion, visual information outside the visual field is compressed into the same visual field range as usual, causing an increase in the depth of the visual environment, as if the camera is zooming out. As shown in Figure 8, this compression and increase in depth sharpens the velocity vectors of the visual information in the depth direction, bringing both vectors approaching and receding from the observer into the visual field simultaneously. In other words, when expanding the FOV, the visual information rapidly approaches the observer from the center of the FOV, and once it goes beyond a certain range, it begins to follow a trajectory that expands the edge of the FOV. These changes may have influenced the viewer’s impression of the image by imparting a sense of object motion intensity in the visual environment
Figure 8: Visual effects of FOV expansion.
Effects of Field-of-View Expansion Using a Wide-Field HMD on Sensibility 37
and the extent of the visual environment. Additionally, the lack of a simi- lar trend observed in the random dot condition is likely due to the fact that random dots have limited variations in shape and shade, making it difficult to obtain crucial distance information necessary for depth perception and velocity perception.
Mood Measurement Based on the comparison results of scale score differences for outdoor con- ditions, the increase in mood arousal and vitality was significantly greater before and after viewing videos at a 360
viewing angle than before and after viewing videos at a 200
viewing angle. Although statistical significance was only observed under the above conditions, this result suggests that expanding the FOV may increase the vitality and liveliness of human psychological sta- tes, potentially leading to a change towards a state of excitement and energy. Furthermore, the elements of “energetic” and “lively” that are inherent in the scales of vitality and arousal are very similar to the components of the dyna- mic factor in the previous impression evaluation. Therefore, we believe that the increased dynamism and openness of the video due to the expansion of the FOV changes the viewer’s mood towards a state of excitement and energetic. Although the effects on mood states were prominent in outdoor conditions in this experiment, this suggests that the visual effects of FOV expansion may be particularly beneficial when combined with natural landscapes, such as grass, trees, and blue sky, which are known to reduce fatigue and improve mood. Therefore, when considering the application of FOV expansion technology to sports support in the future, it is necessary to consider the variability of its effectiveness depending on the visual environment.
CONCLUSION
To investigate the effects of FOV expansion on the sensibility induced by kine- tic visual environments, we created three straight-line video clips of visual environments and measured the participants’ impressions of the video and changes in mood during video viewing. The experimental results showed that expanding the FOV increased the sense of dynamism and spaciousness of the visual environment and led to improvements in viewers’ activation and arou- sal levels. These findings suggest that expanding the FOV not only improves the impression of the visual environment, but also has the potential to change the mood of the viewers to a more energetic state. However, this study only roughly indicated the effect of visual field expansion and did not fully discuss differences in the effects between different visual environments, changes in the properties of the video, and their causes.Therefore, In the future, we plan to conduct a spatial frequency analysis of the video used in the experiment to evaluate the relationship between the FOV expansion, impression of visual environment, and mood changes in more detail from the perspective of chan- ges in the power spectrum. Furthermore, based on these findings, we aim to improve the real-time visual field expansion system and construct an exercise support system that maximizes human capabilities.
REFERENCES
Fujinaga, T., Uchida, N., Shigemasu, K., Sugiyama, K. (2013). The Latest Dictionary of Psychology: Heibonsha Ltd. Fujita, Y., Yamaguchi, Y., Shiina, K., (2008). The Influence of the Production Tech-
niques on Impression of Video Contents: On the Effect of Transitions, Journal of Information and Media Studies, Volume 7, No. 1., pp. 1–13. Fukue, K., Ozawa, K., Kinoshita, Y., (2012). Study on Multidimensional Structure of the Sense of Presence in Audio-Visual Content, Transactions of Japan Society of Kansei Engineering, Volume 11, No. 2., pp. 183–192. Ikeda, F., Tokunaga, F. (2008). Overview: Processing and utilization of visual
information, Information Processing, Volume 50, No. 1., pp. 3–7. Kano, C. (1991). Self-Motion Perception and Visual Information, Japanese Psychological Review, Volume 34, No. 2., pp. 240–256. Koishi, T., Keiichi, W., Kazunori, K. (2022) “Effects of Field-of-View Expan-
sion Using a Wide-field HMD on Active Linear Motion”, 13th International Conference on Applied Human Factors and Ergonomics (AHFE2022). Sakairi, Y., Tokuda, H., Kawahara, M., Tanigi, T., Soya, H. (2012). Development of the Two Dimension Mood Scale for Measuring Psychological Arousal Level and Hedonic Tone, Transactions of Japan Society of Kansei Engineering, Volume 11, No. 2., pp. 183–192. Tazaki, S., Ando, T., Koshi, K., Koga, H., Wada, C. (2003). Effect of Image-
size Differences on 3D Giant Stereo Image Screen and of 2-Projector Images on Visual Fatigue, The Journal of The Institute of Image Information and Television Engineers, Volume 57, No. 12., pp. 1717–1726.
LISTED IN THE AHFE DIGITAL BOOKSTORE CATALOGUE
Explore the complete digital volume
Affective and Pleasurable Design
Read this individual research paper free through the original publisher, or explore the full digital proceedings book.
ISBN 978-1-958651-47-6
Explore this ISBN in the AHFE Bookstore ↗Listed in the July 2026 bookstore catalogue; search by ISBN to confirm current availability · Digital book purchase optional