Fan Zhang, Jing Zhao, Xuan Zhang (2023). Estimation of relative standard deviation related to limit of detection and limit of quantitation. In: Production Management and Process Control. AHFE Open Access, vol. 104, pp. 36–40. https://doi.org/10.54941/ahfe1003050
Limit of detection (LOD) is usually determined by calculation of the standard deviation of measurements of blank samples. In several technical reports, LOD is defined as the concentration at the relative standard deviation (RSD) 30% (or other values) for repeated measurements. Similarly, limit of quantitation (LOQ) is also defined at the RSD level 10%. When a laboratory starts to use a method, the method verification should be carried out in advance to guarantee this method can be implemented correctly and the method characteristics (eg. LOD and LOQ) can be satisfied in this lab. But in routine test, this verification is not conducted every time and the measurement result might be effected by several factors. Then the verification results can vary under different test conditions. In this article the critical value of relative standard deviation is presented, when the RSD from routine test of blank samples of n times larger than the critical value it can be concluded that this measurement system cannot meet the requirement of LOD/LOQ that defined by the methods related with RSD. This method shows a quick check whether the routine measurement can satisfy the defined LOD/LOQ.
Limit of detection (LOD) and limit of quantitation (LOQ) are two impor- tant characteristics for measurement and test methods. This is an important indicator to evaluate the laboratory’s ability and quality assurance for low concentration samples. The research on LOD and LOQ determination meth- ods have always been interested by researchers. Several organizations and institutes have published a few standards and technical reports. The pro- cedures can generally classified into two categories: standard deviation for blank samples [US environmental protection agency, 1997] and statistical models based on calibration curves [IUPAC,1998; ASTM D 7091, 2007; ISO 11843-2, 2000]. The first approach is easy to achieve, and the other one usually need samples on several levels to establish the statistical model (calibration function) which is more complicated. In measurement and test laboratories, the first approach is often used in routine measurement.
In laboratories LOD is defined as the lowest concentration of the analyte that can be detected by the method at a specified level of confidence. And LOQ is the lowest concentration at which the measurement performance
Estimation of Relative Standard Deviation Related 37
is acceptable for a typical application. The concept of LOD is statistically the lowest concentration that can distinguish from blank at a level of con- fidence. The value at LOD just indicates the existence of the analyte, not accurate value of the analyte. But for LOQ the values above it is considered accurate that can be acceptable. To obtain detection limit, it must be based on the analysis of samples that have been taken through the whole measu- rement procedure including sample preparation using results calculated with the same equation as for the test samples.
In the first approach mentioned above, both LOD and LOQ are normally calculated by multiplying a standard deviation of blank samples by a suitable factor. Some typical definitions of LOD and LOQ are as follows,
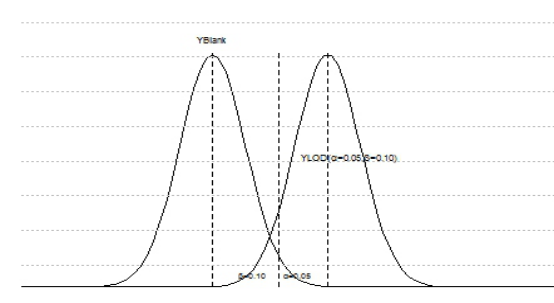
1) IUPAC 1975 recommended repeated measurement of 10 blank samples, the derived standard deviation is Sb. Then LOD is 3Sb and LOQ is 10Sb. This definition is based on the type I risk α=0.05 and type II risk β=0.10. Then the upper limit of confidence interval of the concen- tration of the blank samples is 2.927Sb with the confidence level 0.10 which assuming the concentration follows normal distribution. Then LOD = 2.927sb≈3sb represents that it is the limit concentration of analyte that can be distinguished from the blank samples (see Figure 1).
Figure 1: Distribution illustration for the case α=0.05 and β=0.10.
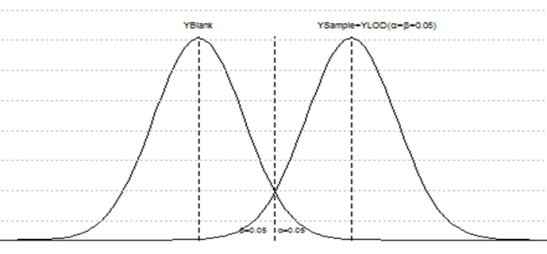
2) When the two types of risks changed to α=β=0.05, IUPAC 1997 recom- mended LOD = 3.3sb, where sb is the standard deviation of measurement results of blank sample with 10 repetitions and at this situation 1.645 sb is the limit content. See Figure 2. 3) Measure the sample and blank respectively, and the sample result is the measured value of the sample value minus the blank value. Let sb denote the standard deviation of measurement results of blank sample with 10 repetitions. Then the LOD can be calculated as 4.65 sb (equals to 3.3 × √
Equations and mathematical formulas are available in the original paper PDF.
2), where α = β= 0.05. And in this situation, LOQ is calculated as 14.1 sb (equals to 10×
2), where sb is the standard deviation of measurement results of blank sample with 10 repetitions.
When above approaches are used in LOD and LOQ determination, the corresponding relative standard deviation (RSD) is also changed according to
Figure 2: Distribution illustration for the case α=β=0.05.
the different approaches at different levels. In some standards and technical reports of measurement methods, LOD, LOQ and RSD are all contained in the document as important characteristics of the methods. But the values in fact are highly related that sometimes may be ignored. In this paper, the interval estimates for RSD at the concentration level of LOD and LOQ is derived. It can be used for checking the RSD defined for some measurement and test methods whether matching the LOD or LOQ that demonstrated in the document.
INTERVAL ESTIMATION FOR RSD For most measurement methods, the standard deviations are changing as the concentration level varied. Usually the standard deviation will increase with the increasing content level and the decreasing RSM. When estimating LOD and LOQ by the approaches mentioned in previous chapter, it is based on the assumption that the calibration curve is a straight line that the slope is 0, and the standard deviation is constant at different levels. It’s always believed that the measurement random error follows normal distribution. When random variable X ∼N(µ, σ 2), let X1, X2, . . . , Xn be n observations that follow that same distribution N(µ, σ 2), so we have
!
X ∼N
µ, σ 2
n
where µ is the mean value of n observations. Then it can be derived that √nµ
σ , 1
(n −1) s2
n−1 (2)
σ 2 ∼χ2
where χ2
i (X −Xi)2 /(n −1).
Estimation of Relative Standard Deviation Related 39
From equation (1) and (2), it can be derived that
σ ,n−1 is the non-central t-distribution with non-central parameter µ√n σ and degree of freedom n-1.
σ ,n−1,
σ ,n−1.
σ ,n−1. (4) The above interval gives a possible way to check the RSD of measurement method whether suitable for their declared LOD (=k · sb).
APPLICATION When determine the LOD and LOQ, measurements on the blank samples are carried out under the repeatability condition. If LOD = 2.93sb is used, it is believed that the concentrations at LOD is a random variable following distribution N(LOD, sb). When 10 replicates are measured, then the RSD based on the samples measurement results will satisfy the relation in equation (4) with the confidence level α = 0.05, i.e.
10 T0.05,
Therefore, if LOD is defined as 2.93sb, then the upper limit of RSD derived from the 10 measurement results from the blank samples should not exceed 49.3% with the significant level 5%. Therefore, for different approaches of LOD determinations, the upper limit of blank sample RSD can be calculated. As for LOQ, it is usually defined as 10sb in most standards and technical reports. The upper limit of RSM can also be calculated. The tale of upper limit of RSD corresponding to different definitions of LOD and LOQ follows in Table 1.
The above table shows the relations between LOD/LOQ and RSM. Alth- ough LOD and LOQ are defined as the standard deviation of the blank sample with 10 repetitions, there is a large difference of RSDs between the distribution of large sample size and those of a small sample size, for that all the calculation is based on the assumption of normal distribution, but for the case of small sample size the distribution may be not approximately normal.
Table 1. Upper limit of RSD corresponding to LOD and LOQ.
This table shows the upper limit RSD corresponding to LOD and LOQ. If some measurement methods for low level detection or trace detection decla- red extremely high RSM, it won’t be possible to detect the analyte in that specified LOD. Therefore it will be useful to check whether LOD/LOQ and RSM for measurement methods are reliable.
ACKNOWLEDGMENT
This research was supported by China National Institute of Standardiza- tion through the “special funds for the basic R&D undertakings by welfare research institutions” (522022Y-9402, 522020Y-7475).
REFERENCES
ASTM Committee D19 on Water and ASTM of Subcommittee D19.02 on General Specifications, Technical Resources, and Statistical Methods. ASTM D6091-2007, Standard Practice for 99%/95% Inter-laboratory Detection Estimate (IDE) for Analytical Methods with Negligible Calibration Error. Technical Committee ISO/TC69, Applications of statistical methods, Subcommit-
tee SC6, Measurement methods and results. ISO 11843-2:2000, Capability of detection – Part 2: Methodology in the linear calibration case. The International Union of Pure and Applied Chemistry (IUPAC). IUPAC compendium of Analytical Nomenclature, 1998. US environmental protection agency, Guidelines establishing test procedures for the
analysis of pollutants. (Appendix B, part 136, definition and procedures for the determination of methods detection limit), 1997: 265–267. Wenzl, T., Haedrich, J., Schaechtele, A., Robouch, P., Stroka, J., Guidance Document on the Estimation of LOD and LOQ for Measurements in the Field of Contami- nants in Feed and Food; EUR 28099, Publications Office of the European Union, Luxembourg, 2016, ISBN 978-92-79-61768-3; doi:10.2787/8931.
LISTED IN THE AHFE DIGITAL BOOKSTORE CATALOGUE
Explore the complete digital volume
Production Management and Process Control
Read this individual research paper free through the original publisher, or explore the full digital proceedings book.
ISBN 978-1-958651-80-3
Explore this ISBN in the AHFE Bookstore ↗Listed in the July 2026 bookstore catalogue; search by ISBN to confirm current availability · Digital book purchase optional